Quarter Ended: March 2026
Nestlé India Q4 FY26 – Results Analysis
NSE
nestleind
BSE
500790
Nestlé India reported a strong Q4 FY26 performance, supported by revenue growth, sharp profit expansion, margin improvement, stronger operating cash flow, and improved balance sheet liquidity.
Both quarterly and full-year results showed healthy execution, with profit growing faster than revenue, indicating operating leverage and earnings quality improvement.
key financial highlights
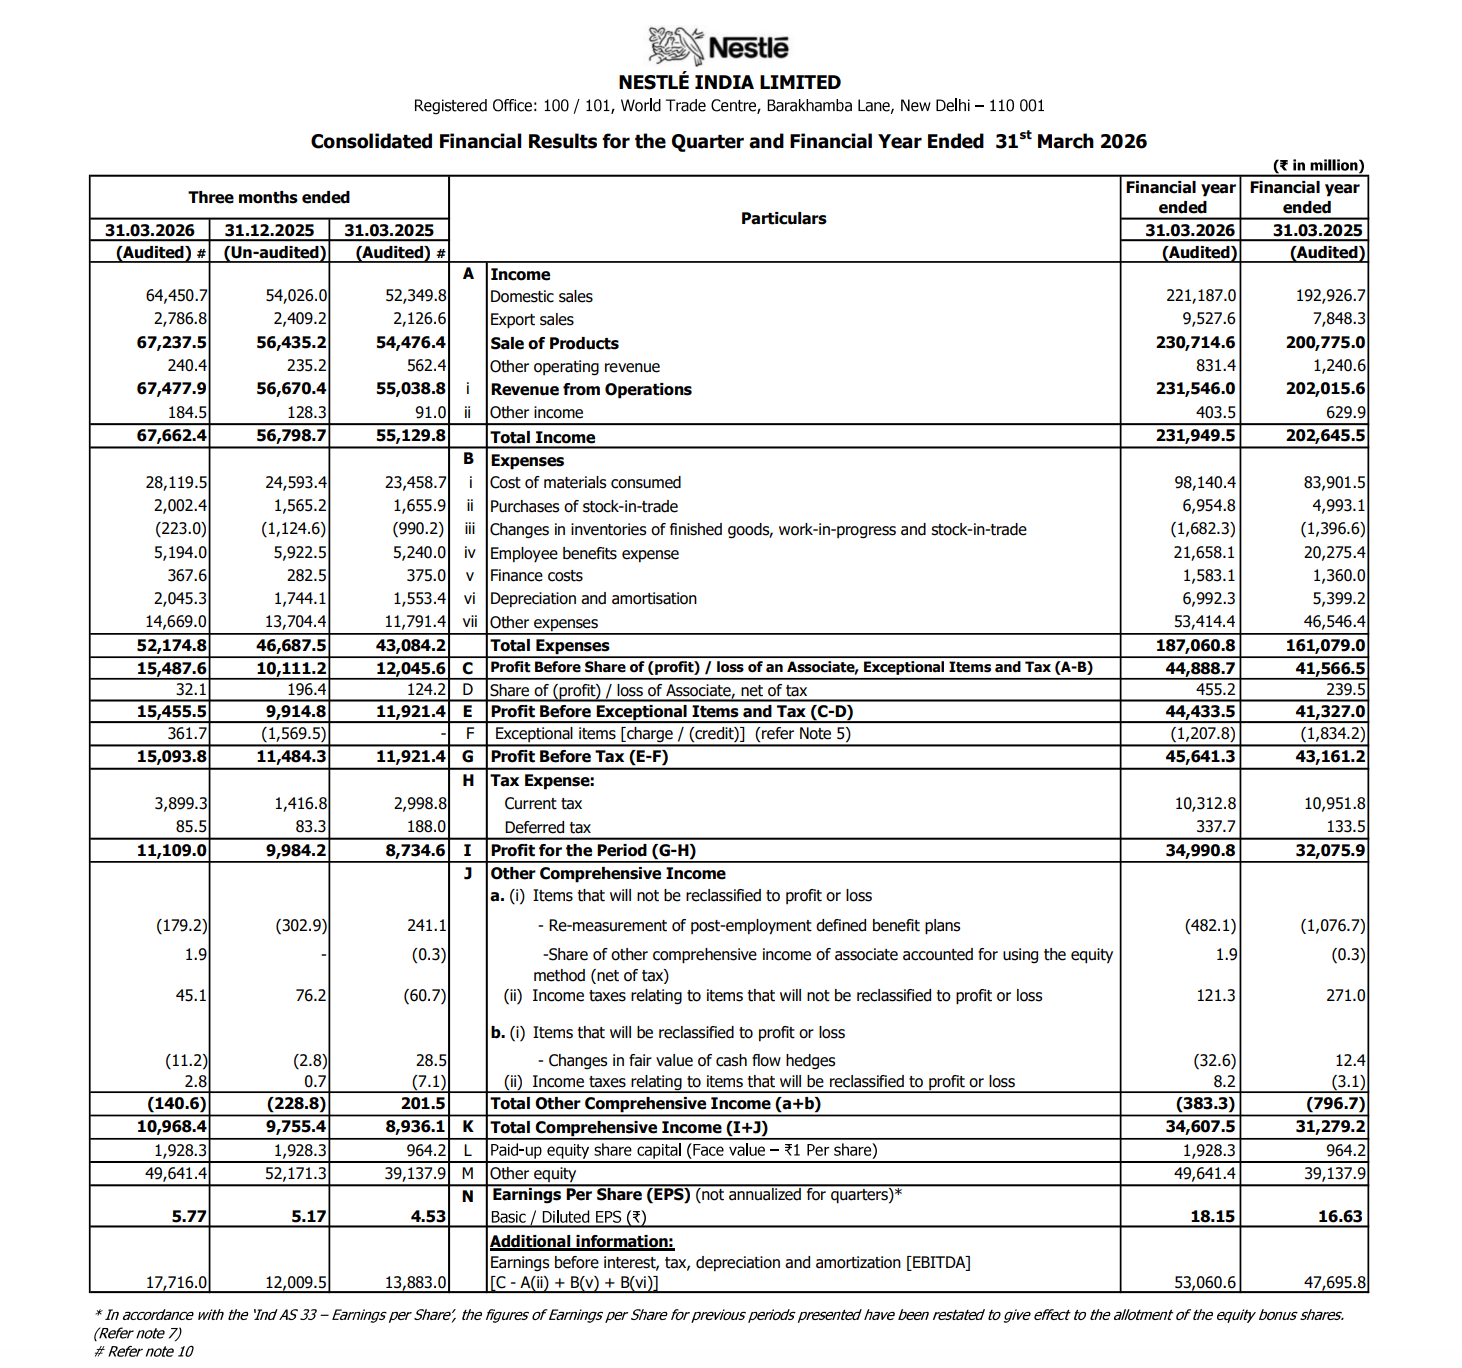
- Revenue from Operations:
- Total Income (Q4 FY26): ₹67,477.9 million
- QoQ Change: +19.08%
- YoY Change: +22.60%
- Previous Quarter (Q3 FY26): ₹56,670.4 million
- Previous Year (Q4 FY25): ₹55,038.8 million
- Total Income (Q4 FY26): ₹67,477.9 million
- Profit After Tax (PAT):
- PAT (Q4 FY26): ₹11,109.0 million
- QoQ Growth: +11.27%
- YoY Growth: +27.19%
- Previous Quarter: ₹9,984.2 million
- Previous Year: ₹8,734.6 million
- PAT (Q4 FY26): ₹11,109.0 million
Margin Analysis
Positives
- Revenue growth outpaced expense growth
- Operating leverage improved
- Inventory changes aided margin structure
- Strong EBITDA growth
Segment insight
Financials indicate:
- Strong consumer demand execution
- Pricing / mix support
- Strong operating efficiency
- Mature high-cash-generation business model
Earning quality check
High Earnings Quality:
- Profit growth appears strongly cash-backed
Supported By:
- Strong operating cash flow
- EBITDA growth
- Higher profits
- Improved liquidity
Interpretation:
- High-quality earnings
balance sheet Analysis
Total Assets:
- FY26: ₹131,824.9 million
- FY25: ₹121,933.2 million
- Growth: +8.11%
Equity:
- FY26: ₹51,569.7 million
- FY25: ₹40,102.1 million
- Growth: +28.59%
Cash & Cash Equivalent:
- FY26: ₹13,205.7 million
- FY25: ₹761.8 million
- Massive Increase
Borrowings:
- FY26: ₹41.5 million
- FY25: ₹7,308.6 million
- Major positive signal
Balance Sheet Insight:
- Higher equity
- Lower borrowings
- Higher liquidity
Cash flow analysis
Operating Cash Flow
- FY26: ₹50,475.6 million
- FY25: ₹29,345.3 million
- Growth: +72%
Investing Cash Flow
- Negative ₹6,236.8 million
- Reflects:
- Normal capex/investment outflow
Financing Cash Flow
- Positive ₹31,794.9 million
- Reflects:
- Dividend payouts
- Debt reduction
Cash Position
- Cash increased:
- FY26: ₹13,205.7 million
- FY25: ₹761.8 million
Indicates: Very strong liquidity improvement
key risks
- Input Cost Volatility – Commodity risk remains
- Valuation Risk – High-quality businesses often trade rich
- Growth Moderation Risk – Consumer demand slowdown remains a macro risk
management strategy signals
- Premiumization
- Margin management
- Cash generation
- Capital discipline
- Brand-led growth
Financial Metrics
| Particular | Q4 FY26 | Q.O.Q | Y.O.Y |
|---|---|---|---|
| Total Income | ₹67,662.4 Million | +19.55% | +22.73% |
| PBT | ₹15,093.8 Million | +31.31% | +26.60% |
| PAT | ₹11,109 Million | +11.27% | +27.19% |
| EPS | ₹5.77 | +11.61% | +27.37% |
Nestlé delivered:
- Strong revenue growth
- Strong PAT growth
- Strong margins
- Exceptional operating cash flow
- Strong liquidity growth
- Sharp reduction in borrowings
Official Exchange Filing: Nestlé India Limited
Quarterly Performance Context
COST OF OPERATIONS AS % OF REVENUE
77%
NET PROFIT AS % OF REVENUE
16.46%
FISCAL YEAR
2025-2026
AUDIT STATUS
REVIEWED