Quarter Ended: March 2026
Persistent Systems Q4 FY26 – Results Analysis
NSE
persistent
BSE
533179
Persistent Systems reported an excellent Q4 FY26 performance, driven by strong revenue growth, sharp profit expansion, robust segment growth, strong cash generation, and significant balance sheet strengthening.
Both quarterly and full-year performance showed broad-based strength, while profitability, liquidity and equity all improved materially.
key financial highlights
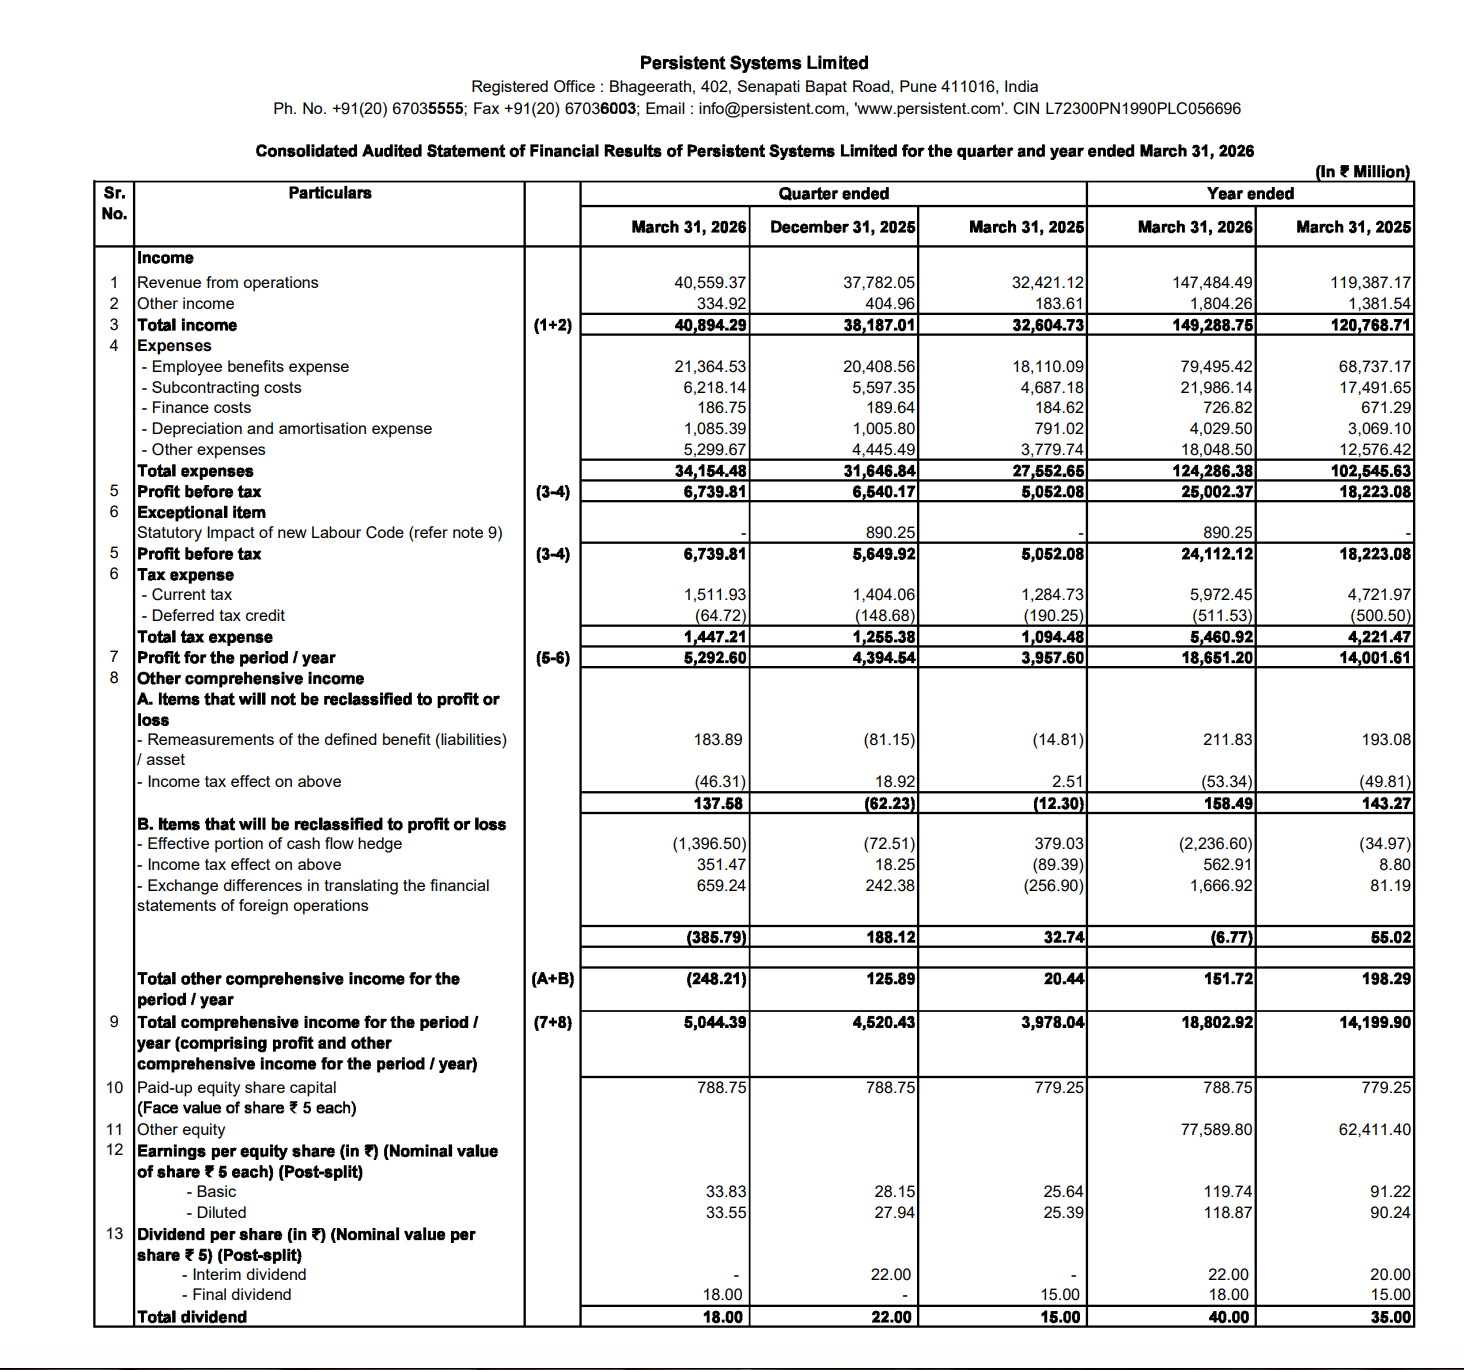
- Revenue from Operations:
- Total Income (Q4 FY26): ₹40,559.37 million
- QoQ Change: +7.35%
- YoY Change: +25.10%
- Previous Quarter (Q3 FY26): ₹37,782.05 million
- Previous Year (Q4 FY25): ₹32,421.12 million
- Total Income (Q4 FY26): ₹40,559.37 million
- Profit After Tax (PAT):
- PAT (Q4 FY26): ₹5,292.60 million
- QoQ Growth: +20.44%
- YoY Growth: +33.72%
- Previous Quarter: ₹4,394.54 million
- Previous Year: ₹3,957.60 million
- PAT (Q4 FY26): ₹5,292.60 million
Margin Analysis
Positives
- Revenue growth outpaced cost growth
- Subcontracting costs remained controlled
- Strong operating leverage
- Higher segment profitability across businesses
Segment performance
BFSI:
| Revenue | YoY Growth | Profit | YoY Growth |
|---|---|---|---|
| ₹13,962.78 million | +33.38% | ₹4,969.07 million | +34.47% |
Healthcare & Life Sciences:
| Revenue | YoY Growth | Profit | YoY Growth |
|---|---|---|---|
| ₹10,662.76 million | +22.68% | ₹3,995.87 million | +19.12% |
Software, Hi-Tech and Emerging Industries:
| Revenue | YoY Growth | Profit | YoY Growth |
|---|---|---|---|
| ₹15,933.83million | +19.72% | ₹5,490.50 million | +23.06% |
- Broad-based strength
- Positive diversification signal
Earning quality check
High Earnings Quality:
- Profit growth strongly cash-backed
Supported By:
- Strong operating cash flow
- Revenue growth
- Profit growth
- Balance sheet strengthening
Interpretation:
- High-quality earnings
balance sheet Analysis
Total Assets:
- FY26: ₹113,765 million
- FY25: ₹87,366 million
- Growth: +30.21%
Equity:
- FY26: ₹78,379 million
- FY25: ₹63,191 million
- Growth: +24.04%
Cash & Cash Equivalent:
- FY26: ₹10,749 million
- FY25: ₹6,744 million
- Growth: +59.38%
Balance Sheet Insight:
- Higher equity
- Higher cash
- Asset growth
Cash flow analysis
Operating Cash Flow
- FY26: ₹17,671 million
- FY25: ₹11,569 million
- Growth: +52.74%
Investing Cash Flow
- Negative ₹6,099 million
- Reflects:
- Normal for growth investment
Financing Cash Flow
- Positive ₹7,482 million
- Reflects:
- Dividends
- Lease payments
Cash Position
- Cash increased:
- FY26: ₹10,749 million
- FY25: ₹6,744 million
Indicates: Strong liquidity improvement
key risks
- Global IT Spending Risk – Macro demand remains a variable
- Margin Pressure Risk – Wage inflation and subcontracting costs remain monitorable
- Currency Risk – FX volatility remains relevant
management strategy signals
- Vertical-led growth
- Margin optimization
- Digital engineering expansion
- Cash discipline
- Segment diversification
Financial Metrics
| Particular | Q4 FY26 | Q.O.Q | Y.O.Y |
|---|---|---|---|
| Total Income | ₹40,894.29 Million | +7.09% | +25.43% |
| PBT | ₹6,739.81 Million | +19.29% | +33.40% |
| PAT | ₹5,292.60 Million | +20.44% | +33.72% |
| EPS | ₹33.83 | +20.18% | +31.94% |
Persistent Systems delivered:
- Strong revenue growth
- Strong PAT growth
- Broad-based segment growth
- Strong operating cash flow
- Higher liquidity
- Strong balance sheet expansion
Official Exchange Filing: Persistent Systems Limited
Quarterly Performance Context
FISCAL YEAR
2025-2026
AUDIT STATUS
REVIEWED