Quarter Ended: March 2026
Tech Mahindra Ltd – Q4 FY26 Results Analysis
NSE
techm
BSE
532755
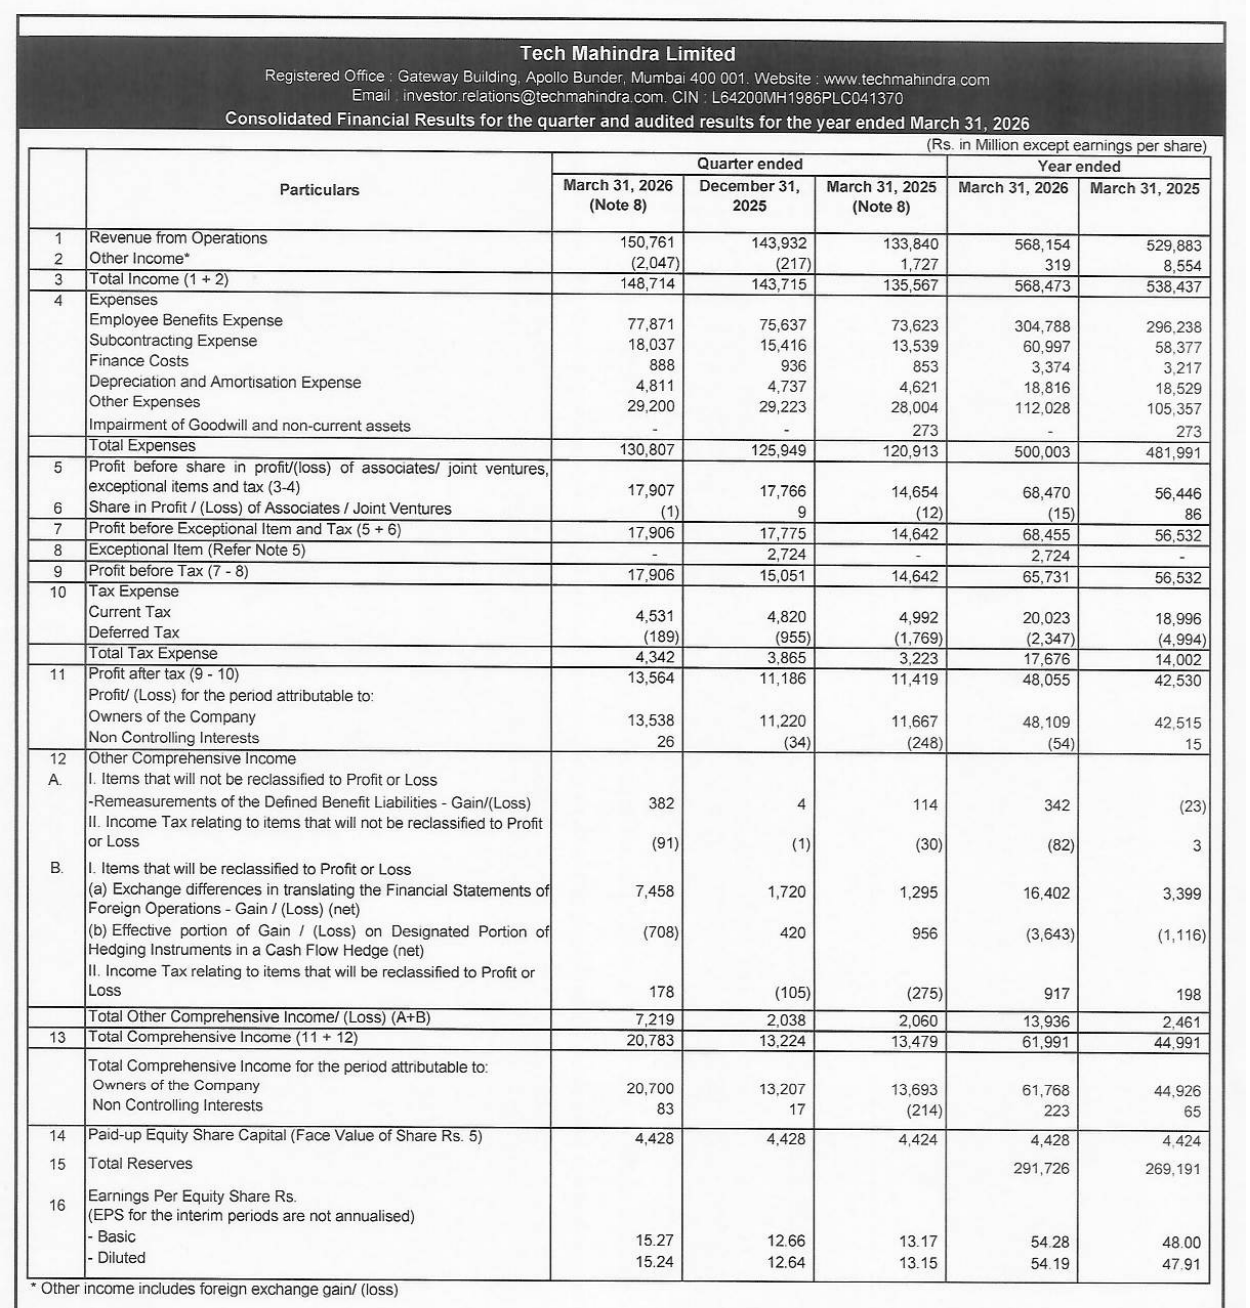
Revenue growth remains stable across segments, but margin pressures and higher costs continue to weigh on profitability despite QoQ improvement.
key financial highlights
- Revenue from Operations:
- Total Income (Q4 FY26): ₹148,714 Million
- QoQ Change: +3.48%
- YoY Change: +9.71%
- Previous Quarter (Q3 FY26): ₹143,715 Million
- Previous Year (Q4 FY25): ₹135,567 Million
- Total Income (Q4 FY26): ₹148,714 Million
- Profit After Tax (PAT):
- PAT (Q4 FY26): ₹13,564 Million
- QoQ Change: +21.37%
- YoY Change: +18.78%
- Previous Quarter (Q3 FY26): ₹11,186 Million
- Previous Year (Q4 FY25): ₹11,419 Million
- PAT (Q4 FY26): ₹13,564 Million
- QoQ Performance
- Revenue Trend: Growth
- Profit Trend: Strong Growth
Margin Analysis
Key Drivers:
- Increase in employee benefit expenses
- Rising subcontracting costs
- Stable revenue growth but cost pressure
Key Signal: Margins are under pressure despite revenue growth, indicating cost inflation in operations
Segment performance
Segment: IT Services
- Revenue: ₹126,608 Million
Insights:
- Core revenue driver
- Stable sequential growth
- Strong contribution to overall margins
Segment: BPS (Business Process Services)
- Revenue: ₹24,153 Million
Insights:
- Smaller but growing segment
- Consistent QoQ growth
- Supports diversification
Segment insight
Tech Mahindra operates across IT Services and BPS, with IT being the dominant contributor
Characteristics:
- Diversified service portfolio
- Global exposure
- Revenue stability from enterprise clients
Earning quality check
Drivers:
- Core operating revenue growth
- No major reliance on exceptional items
- Stable segment contribution
Interpretation:
- Earnings are operationally driven and relatively stable, unlike investment-led companies
balance sheet Analysis
- Total Assets: ₹493,694 Million
- Total Liabilities: ₹192,924 Million
Insight:
- Strong balance sheet with healthy asset base and manageable liabilities, supporting growth
key risks
- Rising employee and subcontracting costs
- Margin pressure due to cost inflation
- Dependence on global IT spending cycles
- Currency fluctuation impact
management strategy signals
- Strengthening IT services
- Expanding BPS segment
- Cost optimization
- Digital transformation services
Financial Metrics
| Particular | Q4 FY26 | Q.O.Q | Y.O.Y |
|---|---|---|---|
| Total Income | ₹148,714 Million | +3.48% | +9.71% |
| PBT | ₹17,906 Million | +18.97% | +22.29% |
| PAT | ₹13,564 Million | +21.37% | +18.78% |
Tech Mahindra delivered steady growth with improving profitability QoQ, but margins remain under pressure due to rising costs. The business remains fundamentally strong and operationally driven, but efficiency improvement is key for sustained upside
Official Exchange Filing: Tech Mahindra Ltd
Quarterly Performance Context
FISCAL YEAR
2025-2026
AUDIT STATUS
REVIEWED