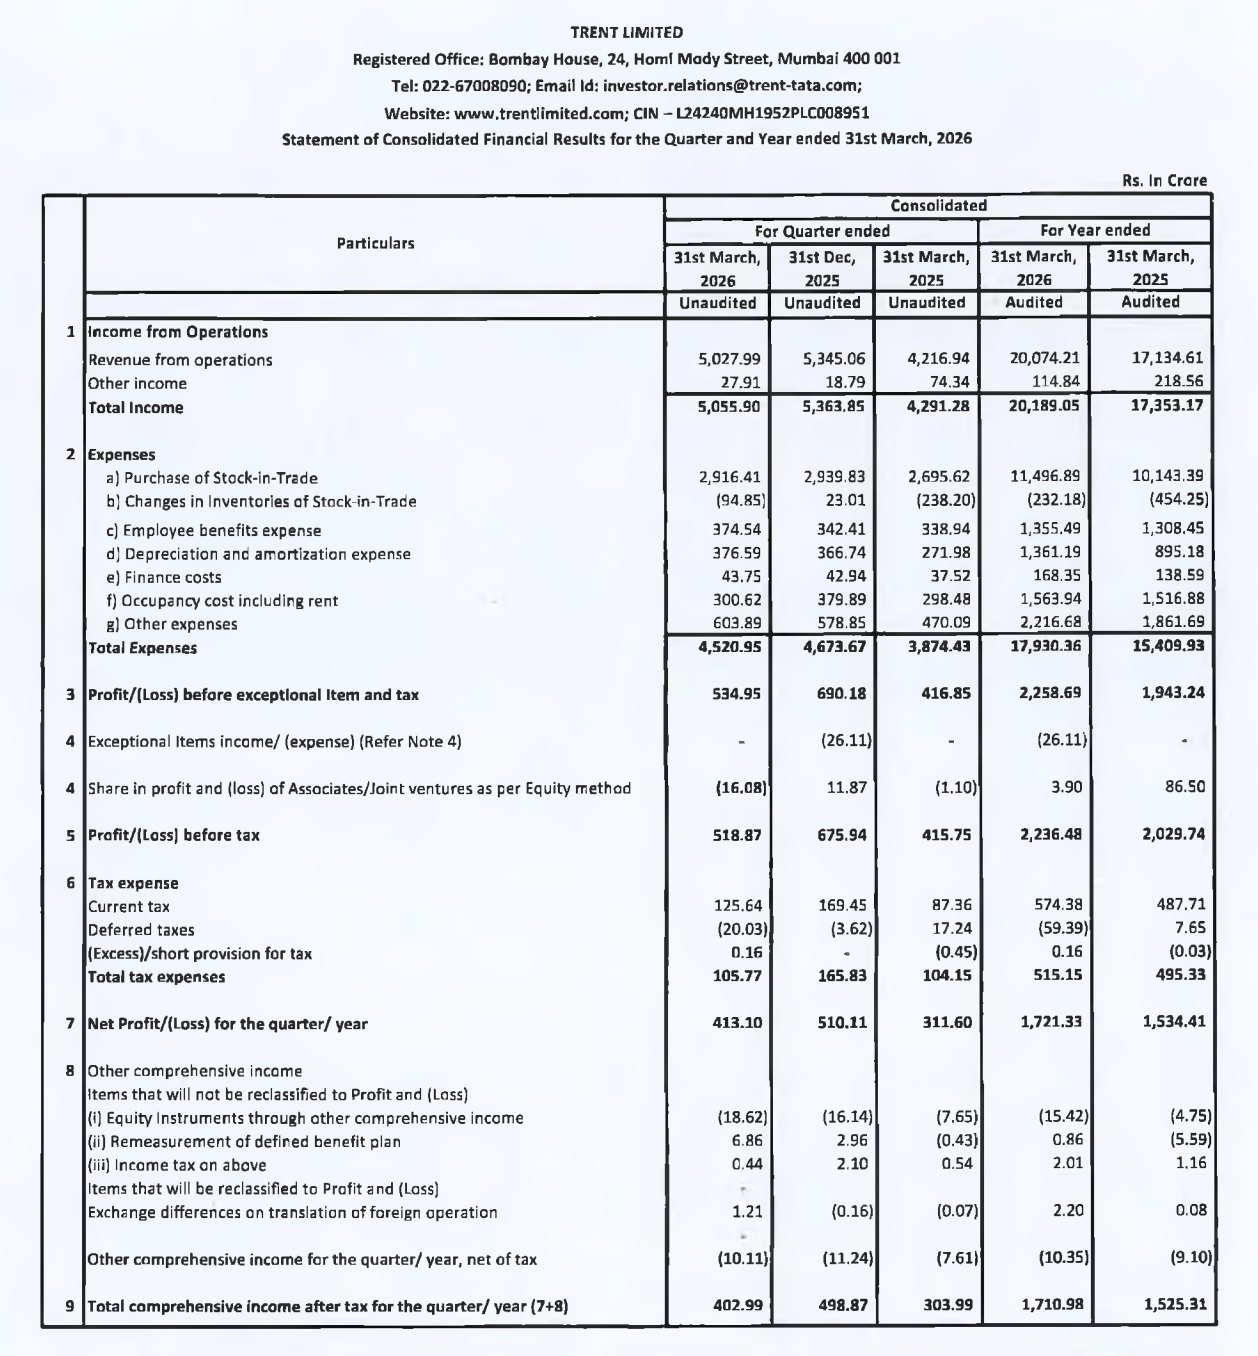
Quarter Ended: March 2026
Trent Ltd – Q4 FY26 Results Analysis
NSE
trent
BSE
500251
Trent reported strong YoY growth driven by retail expansion, but sequential decline in revenue and margins indicates short-term pressure
key financial highlights
- Revenue from Operations:
- Total Income (Q4 FY26): ₹5,055.90 Crores
- QoQ Change: -5.74%
- YoY Change: +17.81%
- Previous Quarter (Q3 FY26): ₹5,363.85 Crores
- Previous Year (Q4 FY25): ₹4,291.28 Crores
- Total Income (Q4 FY26): ₹5,055.90 Crores
- Profit After Tax (PAT):
- PAT (Q4 FY26): ₹413.10 Crores
- QoQ Change: -19.01%
- YoY Change: +32.57%
- Previous Quarter (Q3 FY26): ₹510.11 Crores
- Previous Year (Q4 FY25): ₹311.60 Crores
- PAT (Q4 FY26): ₹413.10 Crores
- QoQ Performance
- Revenue Trend: Decline
- Profit Trend: Decline
Margin Analysis
Key Drivers:
- Decline in revenue QoQ
- Expenses remained relatively high
- Retail expansion costs
Key Signal: Margins compressed sequentially, despite strong YoY growth
Segment performance
Segment: Limited (Not explicitly disclosed in detail)
Insights:
- Core growth driven by retail formats (Zudio, Westside)
- Expansion-led growth strategy
- Scale improving YoY
Segment insight
Trent operates a retail-driven business model, focusing on fashion and value retail
Characteristics:
- High growth retail expansion
- Store-led revenue model
- Seasonal demand impact
Earning quality check
Drivers:
- Strong revenue growth YoY
- No heavy reliance on exceptional income
- Retail-driven operational performance
Interpretation:
- Earnings are operationally strong but sensitive to cost cycles and expansion phase
balance sheet Analysis
- Total Assets: ₹11,728.58 Crores
- Total Liabilities: ₹4,620.62 Crores
Insight:
- Healthy balance sheet with strong equity growth, supporting aggressive expansion
key risks
- Margin pressure due to expansion
- Retail demand volatility
- Inventory management risks
- Competition in value retail segment
management strategy signals
- Aggressive store expansion (Zudio focus)
- Strengthening value retail
- Improving operational efficiency
Financial Metrics
| Particular | Q4 FY26 | Q.O.Q | Y.O.Y |
|---|---|---|---|
| Total Income | ₹5,055.90 Crore | -5.74% | +17.81% |
| PBT | ₹518.87 Crore | -23.24% | +24.79% |
| PAT | ₹413.10 Crore | -19.01% | +32.57% |
Trent continues to deliver strong YoY growth backed by aggressive retail expansion, but Q4 shows short-term pressure on revenue and margins.
Official Exchange Filing: Trent Ltd
Quarterly Performance Context
COST OF OPERATIONS AS % OF REVENUE
89%
NET PROFIT AS % OF REVENUE
8.17%
FISCAL YEAR
2025-2026
AUDIT STATUS
REVIEWED