Quarter Ended: March 2026
Greenply Industries Ltd – Q4 FY26 Results
NSE
greenply
BSE
526797
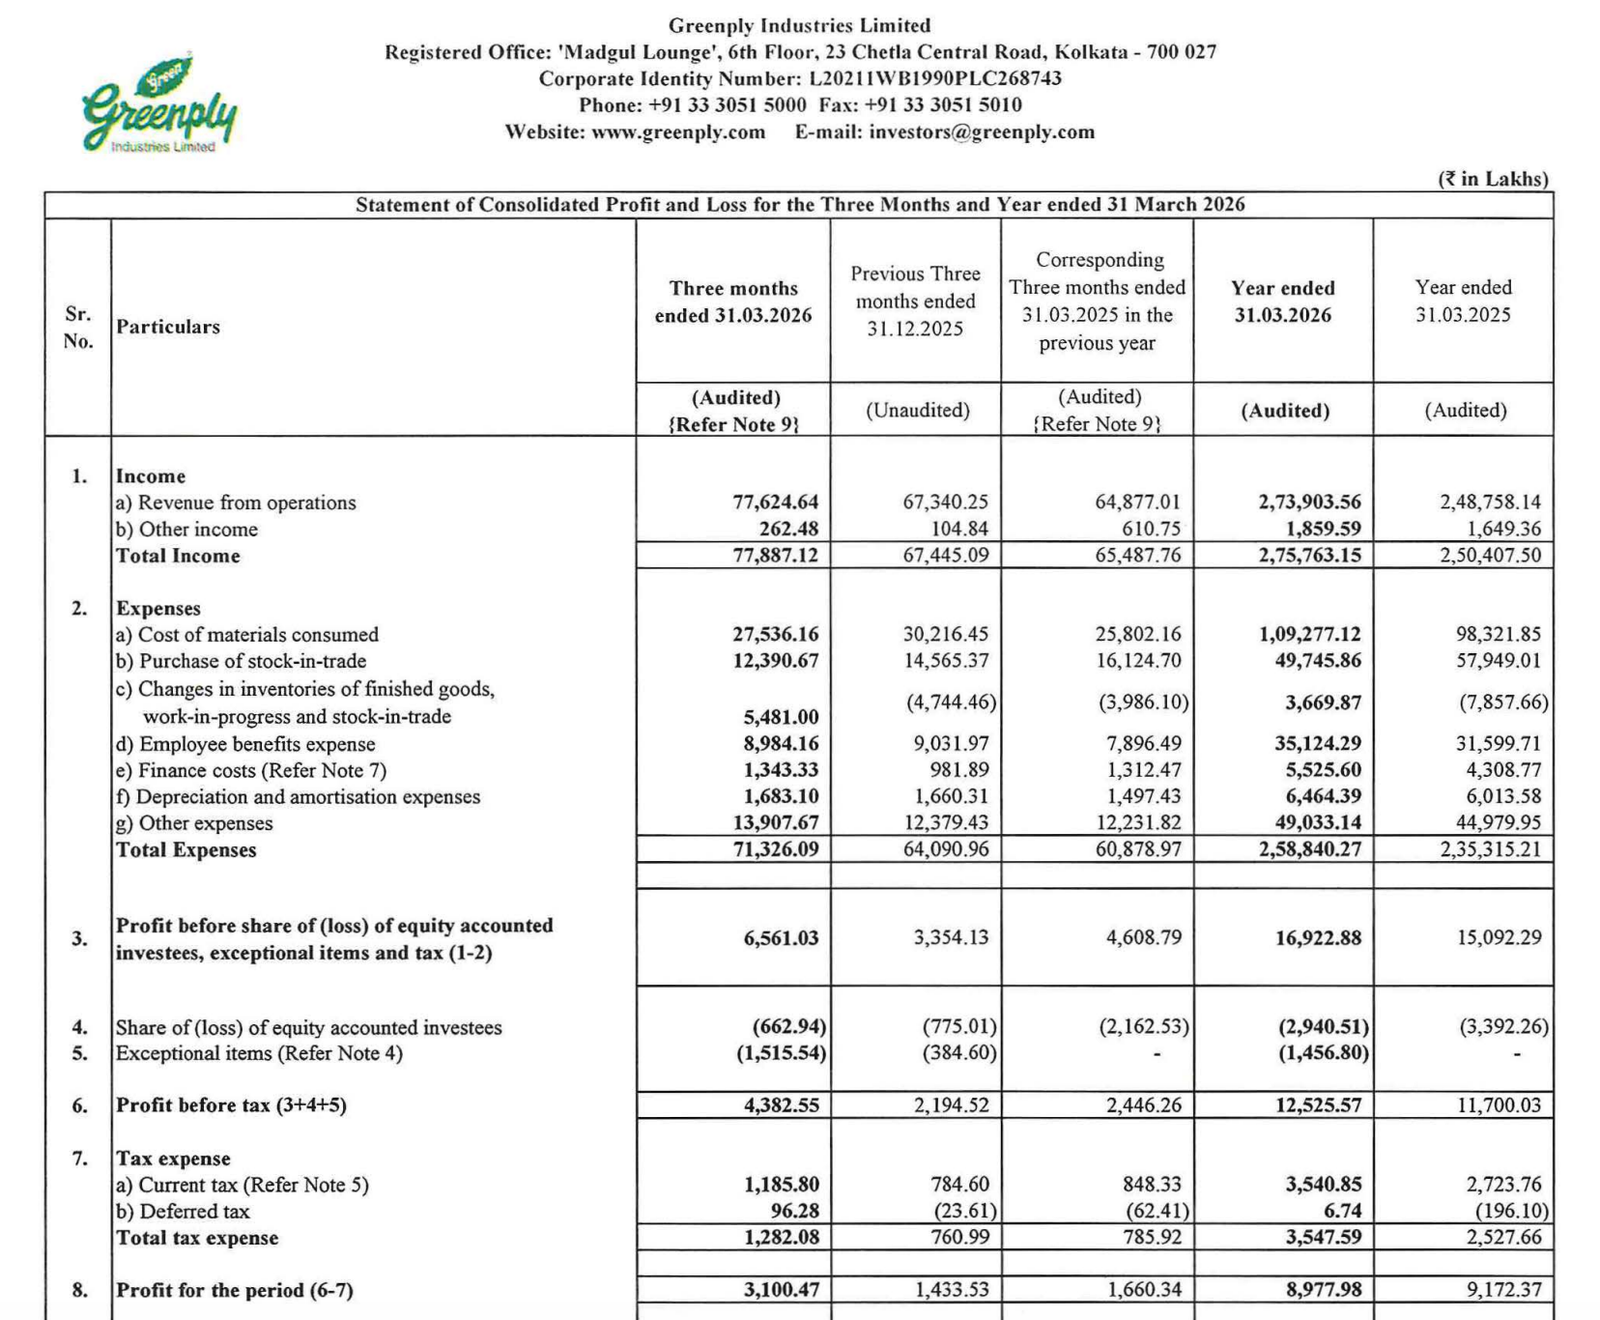
Revenue growth supported by both plywood and MDF segments, while operating leverage and cost control drove sharp profitability improvement
key financial highlights
- Revenue from Operations:
- Revenue (Q4 FY26): ₹7,762.46 Cr
- QoQ Change: +15.3%
- YoY Change: +19.7%
- Previous Quarter (Q3 FY26): ₹6,734.03 Cr
- Previous Year (Q4 FY25): ₹6,487.70 Cr
- Revenue (Q4 FY26): ₹7,762.46 Cr
- Profit After Tax (PAT):
- PAT (Q4 FY26): ₹310.05 Cr
- QoQ Change: +116.3%
- YoY Change: +86.7%
- Previous Quarter (Q3 FY26): ₹143.35 Cr
- Previous Year (Q4 FY25): ₹166.03 Cr
- PAT (Q4 FY26): ₹310.05 Cr
- QoQ Performance
- Revenue Trend: Strong growth
- Profit Trend: Sharp recovery
Margin Analysis
Key Drivers:
- Operating leverage from higher volumes
- Better product mix (MDF growth)
- Controlled raw material cost inflation
- Improved cost efficiency
Key Signal: Margins expanded meaningfully as cost growth lagged revenue growth, indicating strong operating discipline
Segment performance
Segment: Plywood & Allied Products
Revenue: ₹5,873.84 Cr
Insights:
- Core segment (~75% contribution)
- Stable demand and pricing
Segment: MDF & Allied Products
Revenue: ₹1,889.49 Cr
Insights:
- Fastest growing segment
- Higher margin profile vs plywood
Segment insight
Summary:
- Greenply is successfully transitioning toward MDF-led growth, which is structurally higher margin and scalable
Characteristics:
- MDF = Growth + Margin driver
- Plywood = Stable cash generator
- Balanced portfolio improving profitability
Earning quality check
Drivers:
- Strong operating cash flow: ₹246.88 Cr
- Working capital improvement (inventory reduction)
- Lower reliance on non-operating income
Interpretation:
- Earnings quality is high, driven by core operations and cash generation
balance sheet Analysis
- Total Assets: ₹19,616.54 Cr
- Total Liabilities: ₹10,662.83 Cr
Insight:
- Strong equity base (~₹8,953 Cr)
- Controlled leverage
- Improved working capital cycle
key risks
- Raw material cost volatility (timber)
- Demand slowdown in real estate
- Competitive pressure in MDF segment
- Capex execution risks
management strategy signals
Focus Area:
- MDF capacity expansion
- Premium product positioning
- Distribution expansion
- Brand strengthening
Financial Metrics
| Particular | Q4 FY26 | Q.O.Q | Y.O.Y |
|---|---|---|---|
| Total Income | ₹7,788.71 Crore | +15.3% | +18.9% |
| PBT | ₹438.26 Crore | +99.7% | +79.2% |
| PAT | ₹310.05 Crore | +116.3% | +86.7% |
Greenply has delivered a high-quality quarter, with:
- Strong revenue growth
- Sharp margin expansion
- Significant PAT recovery
The company is clearly benefiting from its MDF strategy, making it a margin expansion story rather than just volume growth.
Official Exchange Filing: Greenply Industries Ltd
Quarterly Performance Context
COST OF OPERATIONS AS % OF REVENUE
92%
NET PROFIT AS % OF REVENUE
4%
FISCAL YEAR
2025-2026
AUDIT STATUS
REVIEWED