Quarter Ended: March 2026
5paisa Capital Ltd – Q4 FY26 Results
NSE
5paisa
BSE
540776
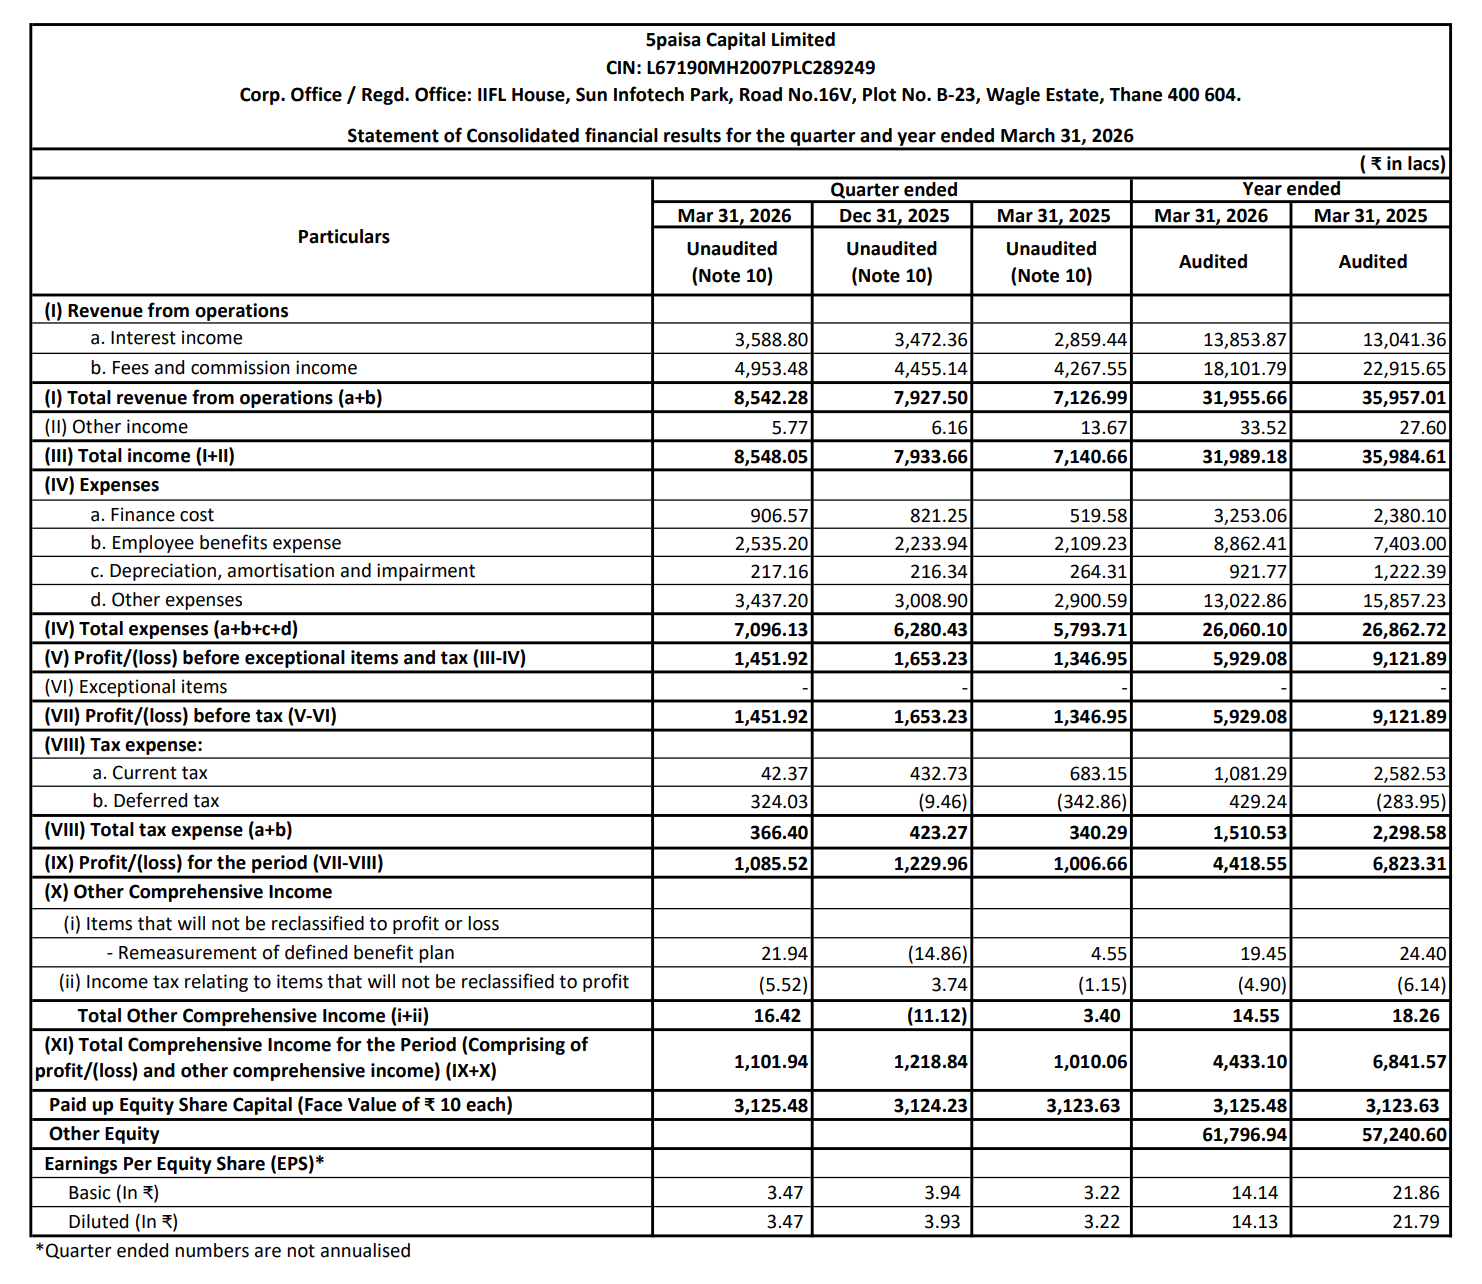
While revenue growth remains stable, sharp decline in profitability (QoQ & YoY) indicates pressure on margins, higher finance costs, and operating inefficiencies.
key financial highlights
- Revenue from Operations:
- Revenue (Q4 FY26): ₹8,548.05 Cr
- QoQ Change: +7.7%
- YoY Change: +19.7%
- Previous Quarter (Q3 FY26): ₹7,933.66 Cr
- Previous Year (Q4 FY25): ₹7,140.66 Cr
- Revenue (Q4 FY26): ₹8,548.05 Cr
- Profit After Tax (PAT):
- PAT (Q4 FY26): ₹1,085.52 Cr
- QoQ Change: -11.7%
- YoY Change: +7.8%
- Previous Quarter (Q3 FY26): ₹1,229.96 Cr
- Previous Year (Q4 FY25): ₹1,006.66 Cr
- PAT (Q4 FY26): ₹1,085.52 Cr
- QoQ Performance:
- Revenue Trend: Growth
- Profit Trend: Decline
Margin Analysis
Key Drivers:
- Rising finance costs (₹906 Cr vs ₹821 Cr QoQ)
- Increase in employee expenses
- Elevated operating expenses
Key Signal: Margins are under pressure, as cost growth is outpacing revenue growth
Earning quality check
Drivers:
- Core revenue driven by brokerage + financial services
- No major exceptional gains
- Profit decline largely cost-driven
Interpretation:
- Earnings quality is moderate, but profit compression is a concern
balance sheet Analysis
- Total Assets: ₹1,90,712 Cr
- Total Liabilities: ₹1,25,053 Cr
Insight:
- Strong asset growth driven by financial assets
- Increase in borrowings indicates leverage expansion
Cash flow analysis
- Operating Cash Flow: -₹10,370 Cr
- Investing Cash Flow: -₹666 Cr
- Financing Cash Flow: +₹12,731 Cr
- Net Cash Change: +₹1,694 Cr
Interpretation:
- Negative operating cash flow driven by increase in loans & financial assets
- Company relying on financing inflows (borrowings/CP/OD)
- Indicates growth phase but with liquidity dependency
key risks
- Rising finance cost impacting profitability
- Margin compression
- Dependence on market activity (brokerage business)
- High working capital and financial asset exposure
management strategy signals
Focus Area:
- Expanding financial services ecosystem
- Scaling retail participation
- Improving operating efficiency
Financial metrics table
| Particular | Q4 FY26 | Q.O.Q | Y.O.Y |
|---|---|---|---|
| Total Income | ₹8,548.05 Crore | +7.7% | +19.7% |
| PBT | ₹1,451.92 Crore | -12.2% | +7.8% |
| PAT | ₹1,085.52 Crore | -11.7% | +7.8% |
5paisa Capital shows top-line growth but weakening profitability, with rising costs and declining margins. The business is scaling, but efficiency and cost control will be critical going forward. Overall stance remains cautiously negative in the short term.
Official Exchange Filing: 5paisa Capital Ltd
Quarterly Performance Context
COST OF OPERATIONS AS % OF REVENUE
83%
NET PROFIT AS % OF REVENUE
12.7%
FISCAL YEAR
2025-2026
AUDIT STATUS
REVIEWED