Quarter Ended: March 2026
SRF Limited – Q4 FY26 Results
NSE
srf
BSE
503806
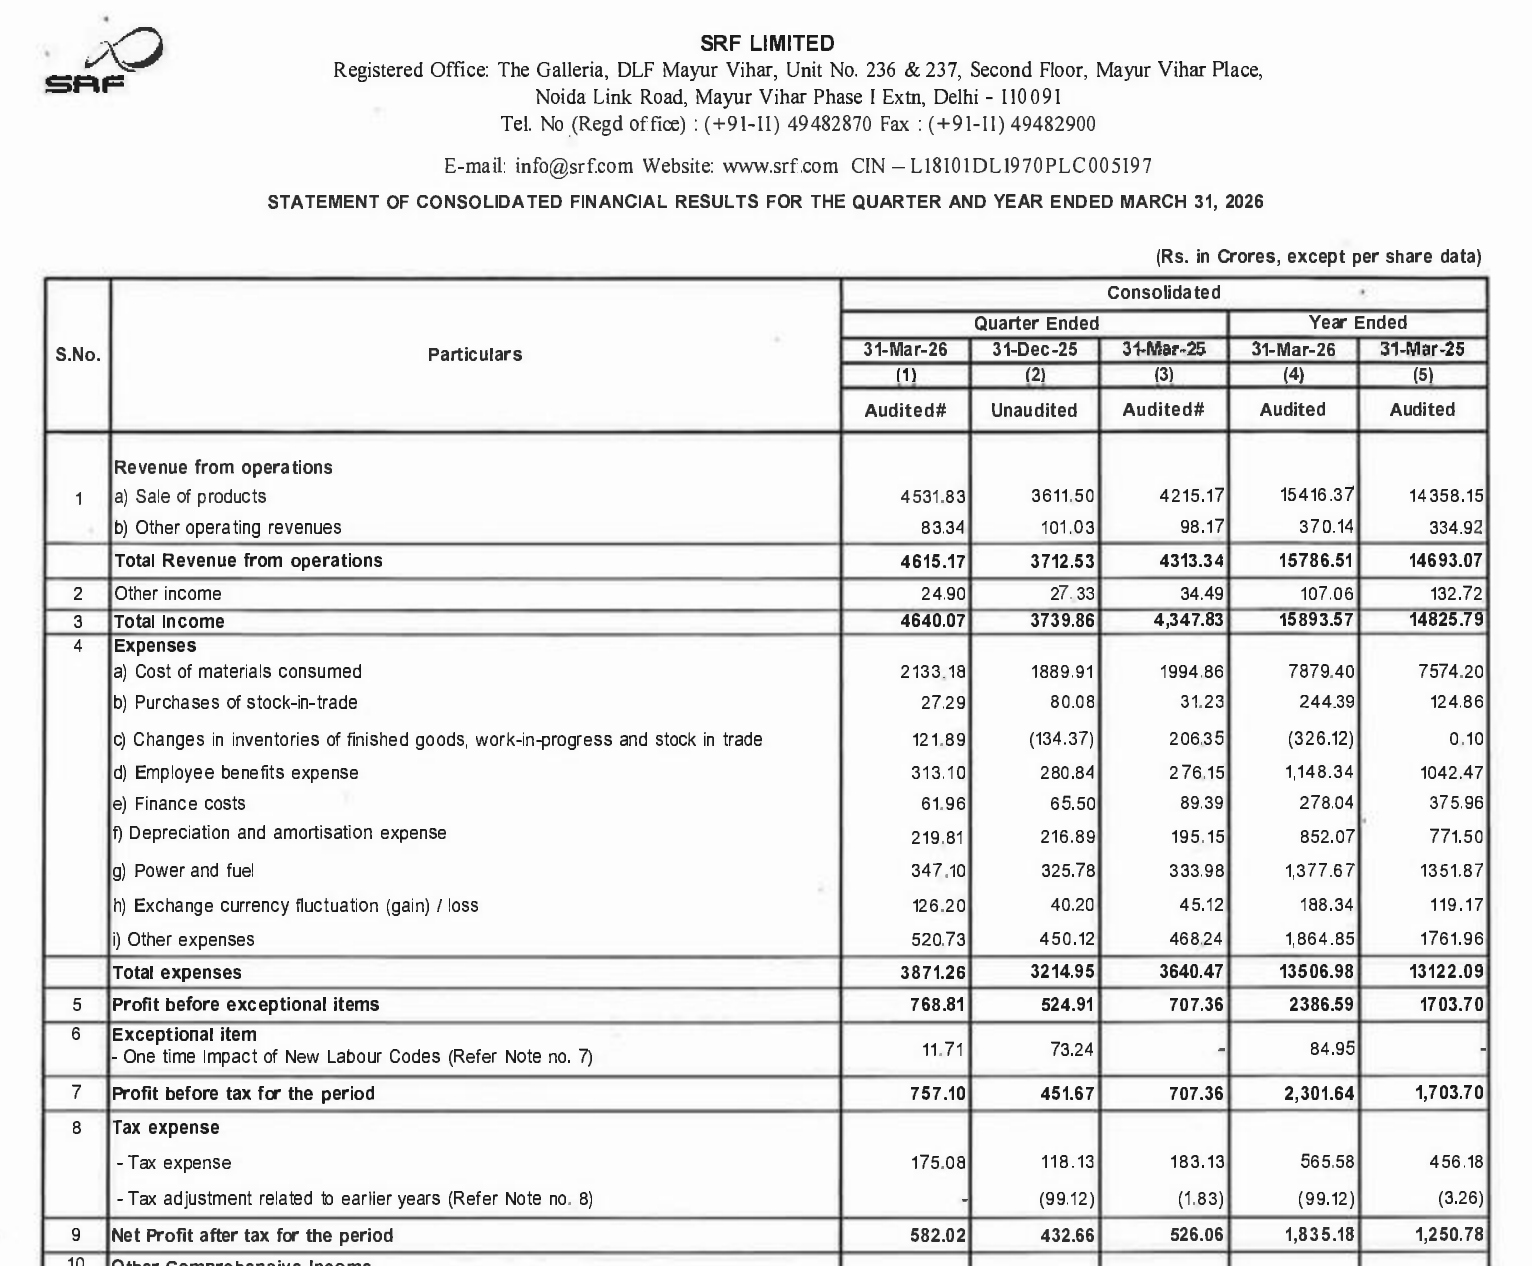
SRF delivered strong revenue and profit growth supported by Chemicals and Performance Films segments, with improved operating leverage despite cost pressures.
key financial highlights
- Revenue from Operations:
- Total Income (Q4 FY26): ₹4,615.17 Crore
- QoQ Change: +24.33%
- YoY Change: +6.99%
- Previous Quarter (Q3 FY26): ₹3,712.53 Crore
- Previous Year (Q4 FY25): ₹4,313.34 Crore
- Total Income (Q4 FY26): ₹4,615.17 Crore
- Profit After Tax (PAT):
- PAT (Q4 FY26): ₹582.02 Crore
- QoQ Change:+34.51%
- YoY Change: +10.64%
- Previous Quarter (Q3 FY26): ₹432.66 Crore
- Previous Year (Q4 FY25): ₹526.06 Crore
- PAT (Q4 FY26): ₹582.02 Crore
- QoQ Performance
- Revenue Trend: Strong Growth
- Profit Trend: Strong Growth
Margin Analysis
Drivers:
- Strong performance in Chemicals segment
- Improved utilization in Performance Films business
- Operating leverage benefits due to higher revenue
- Elevated power and fuel costs partially offset gains
Insight:
- Margin expansion driven by segment mix improvement and operating leverage, despite input cost pressures
Segment performance
Segments: Chemicals Business (CB)
- Revenue: ₹2,448.33 Cr
- Insights:
- Largest contributor to revenue
- Strong YoY and QoQ growth
- Key driver of profitability
Segments: Performance Films & Foil Business (PFB)
- Revenue: ₹1,595.61 Cr
- Insights:
- Significant recovery QoQ
- Improved margins
- Demand stabilization
Segments: Technical Textiles Business (TTB)
- Revenue: ₹482.53 Cr
- Insights:
- Stable performance
- Moderate growth
Segment insight
Summary:
- SRF operates across diversified chemical and specialty segments with Chemicals being the primary growth engine.
Charcateristics:
- Multi-segment diversified business
- Strong chemicals exposure
- Export-oriented operations
- Cyclical but high-margin segments
Earning quality check
Drivers:
- Strong operating profit growth
- Limited dependency on exceptional items
- Improvement in segment profitability
- Stable finance cost relative to scale
Interpretations:
- High-quality earnings driven by core business growth and strong segment contribution.
balance sheet Analysis
- Total Assets: ₹24,146.67 Cr
- Total Liabilities: ₹10,103.91 Cr
Insight:
- Healthy balance sheet with strong equity base, though increase in borrowings indicates ongoing expansion investments.
key risks
- Exposure to global chemical cycles
- Volatility in raw material and energy prices
- Currency fluctuation risks
- Capital-intensive expansion
management strategy signals
Focus Area:
- Expansion in chemicals capacity
- Strengthening specialty chemicals portfolio
- Improving operational efficiency
- Capital investment in growth segments
Financial metrics table
| Particular | Q4 FY26 | Q.O.Q | Y.O.Y |
|---|---|---|---|
| Total Income | ₹4,615.17 Crore | +24.33% | +6.99% |
| EBIT | ₹768.81 Crore | +46.43% | +8.70% |
| PAT | ₹582.02 Crore | +34.51% | +10.64% |
SRF shows strong operational momentum with robust revenue and profit growth driven by its Chemicals segment. While cost pressures and cyclicality remain, the company is well-positioned for long-term growth through capacity expansion and segment strength
Official Exchange Filing: SRF Limited
Quarterly Performance Context
COST OF OPERATIONS AS % OF REVENUE
84%
NET PROFIT AS % OF REVENUE
13%
FISCAL YEAR
2025-2026
AUDIT STATUS
REVIEWED