Quarter Ended: March 2026
Harsha Engineers International Limited – Q4 FY26 Results
NSE
harsha
BSE
543600
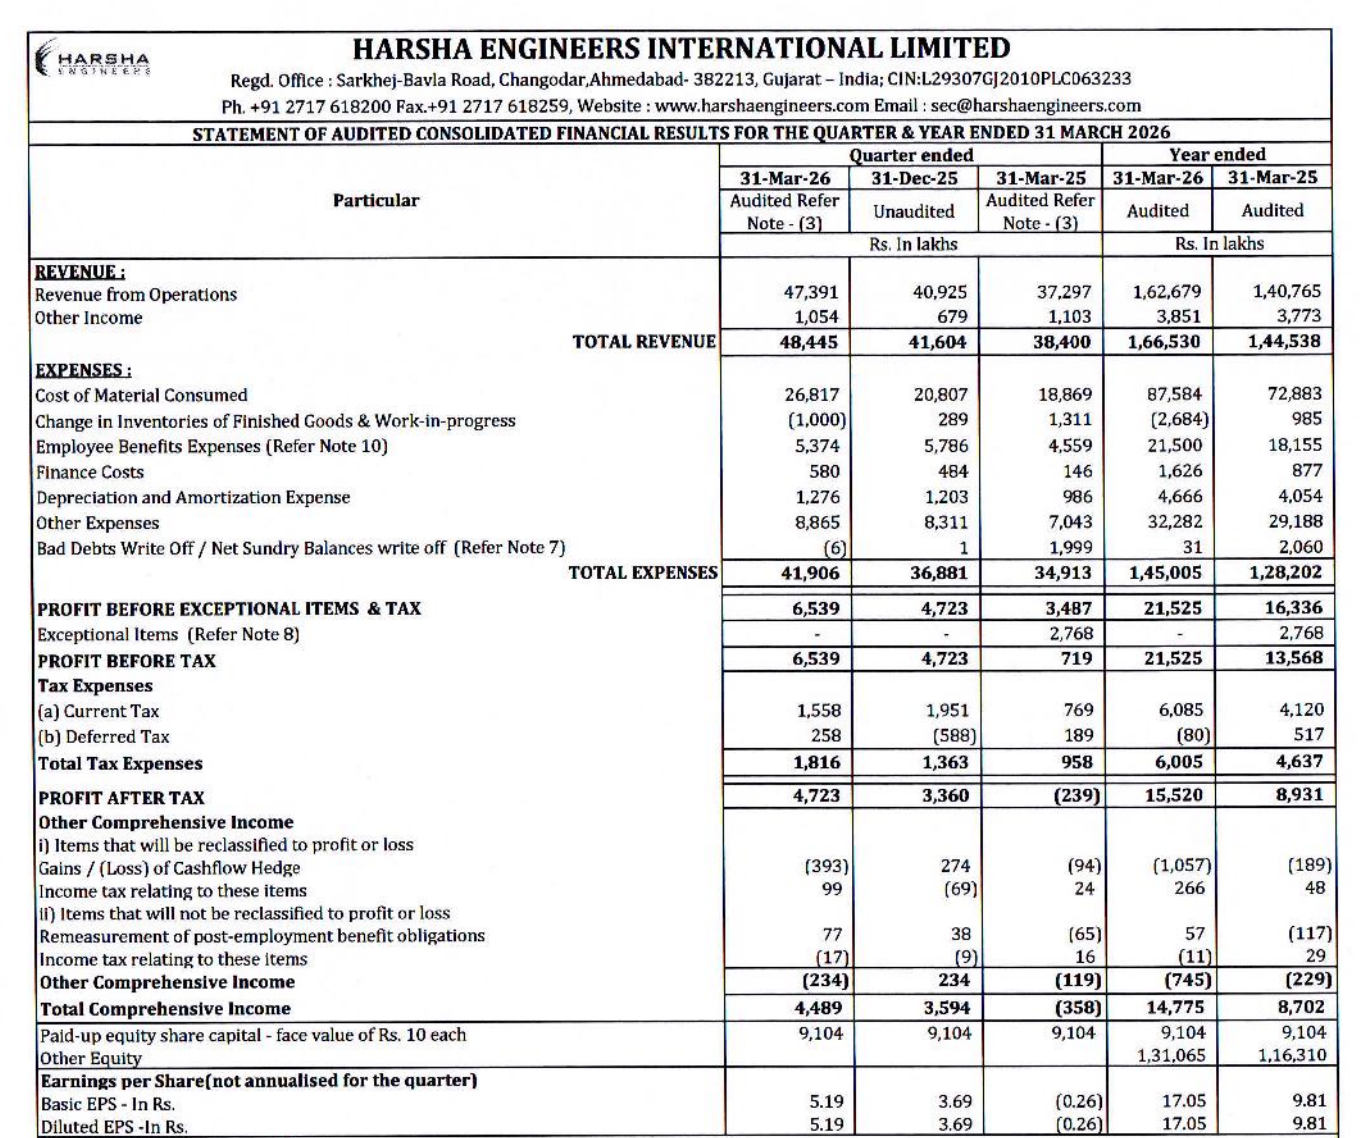
Harsha Engineers reported a strong turnaround in Q4 FY26 with robust revenue growth, sharp profitability expansion, and improving performance from the Solar EPC segment.
key financial highlights
- Revenue from Operations:
- Revenue (Q4 FY26): ₹473.91 Crores
- QoQ Change: +15.80%
- YoY Change: +27.06%
- Previous Quarter (Q3 FY26): ₹409.25 Crores
- Previous Year (Q4 FY25): ₹372.97 Crores
- Revenue (Q4 FY26): ₹473.91 Crores
- Profit After Tax (PAT):
- PAT (Q4 FY26): ₹47.23 Crores
- QoQ Change: +40.57%
- YoY Change: Turnaround
- Previous Quarter (Q3 FY26): ₹33.60 Crores
- Previous Year (Q4 FY25): -₹2.39 Crores Loss
- PAT (Q4 FY26): ₹47.23 Crores
- QoQ Performance
- Revenue Trend: Strong Growth
- Profit Trend: Strong Growth
Margin Analysis
Drivers:
- Strong revenue growth improved operating leverage
- Solar EPC segment turned profitable
- Employee and material costs increased in line with scale-up
- Inventory adjustments aided profitability
- Bad debt write-offs sharply reduced
Insight:
- Operational margins improved significantly as business scale increased and prior-year exceptional impacts normalized.
Segment performance
Segments: Engineering & Others
- Revenue: ₹382.07 Crores
- Insights:
- Core engineering business remained the primary growth driver
Segments: Solar EPC & O&M
- Revenue: ₹91.84 Crores
- Insights:
- Strong YoY expansion with profitability turnaround
Segment insight
Summary:
- The Engineering segment continues to anchor profitability while the Solar EPC business has emerged as a fast-growing secondary growth engine.
Charcateristics:
- Engineering EBITDA expanded strongly
- Solar segment shifted from losses to profits
- Segment assets expanded materially
- Total assets crossed ₹2,000 Crores
- Diversification strategy gaining traction
Earning quality check
Drivers:
- Strong PAT growth supported by operating performance
- Positive operating cash flow generation
- Lower bad debt impact
- Higher working capital investments visible
- Strong balance sheet equity expansion
Interpretations:
- Earnings quality improved materially, though rising receivables and inventory indicate higher working capital intensity
balance sheet Analysis
- Total Assets: ₹2,066.88 Crores
- Total Liabilities: ₹665.19 Crores
Insight:
- The company significantly expanded its balance sheet through capacity investments, higher receivables, and growth in operational scale.
key risks
- Working capital intensity rising sharply
- Solar EPC execution risk
- Commodity and raw material price volatility
- Dependence on industrial capex cycles
- Borrowing levels increased materially
- Export demand fluctuations
management strategy signals
Focus Area:
- Expansion in precision engineering solutions
- Scaling Solar EPC & O&M business
- Capacity expansion
- Export market penetration
- Strengthening operational efficiencies
Financial metrics table
| Particular | Q4 FY26 | Q.O.Q | Y.O.Y |
|---|---|---|---|
| Revenue | ₹473.91 Crores | +15.80% | +27.06% |
| PBT | ₹65.39 Crores | +38.45% | +809.46% |
| PAT | ₹47.23 Crores | +40.57% | Turnaround |
Harsha Engineers delivered a strong operational turnaround in Q4 FY26 with robust revenue growth, substantial profit recovery, and improving diversification through the Solar EPC business.
The company appears to be entering a higher growth phase backed by capacity expansion and segment diversification. However, increasing borrowings and higher working capital intensity will remain key monitoring parameters going forward.
Overall, the results indicate improving business momentum with strong execution across both engineering and renewable-linked businesses.
Official Exchange Filing: Harsha Engineers Limited
Quarterly Performance Context
FISCAL YEAR
2025-2026
AUDIT STATUS
REVIEWED