Quarter Ended: March 2026
Coromandel International – Q4 FY26 Results
NSE
coromandel
BSE
506395
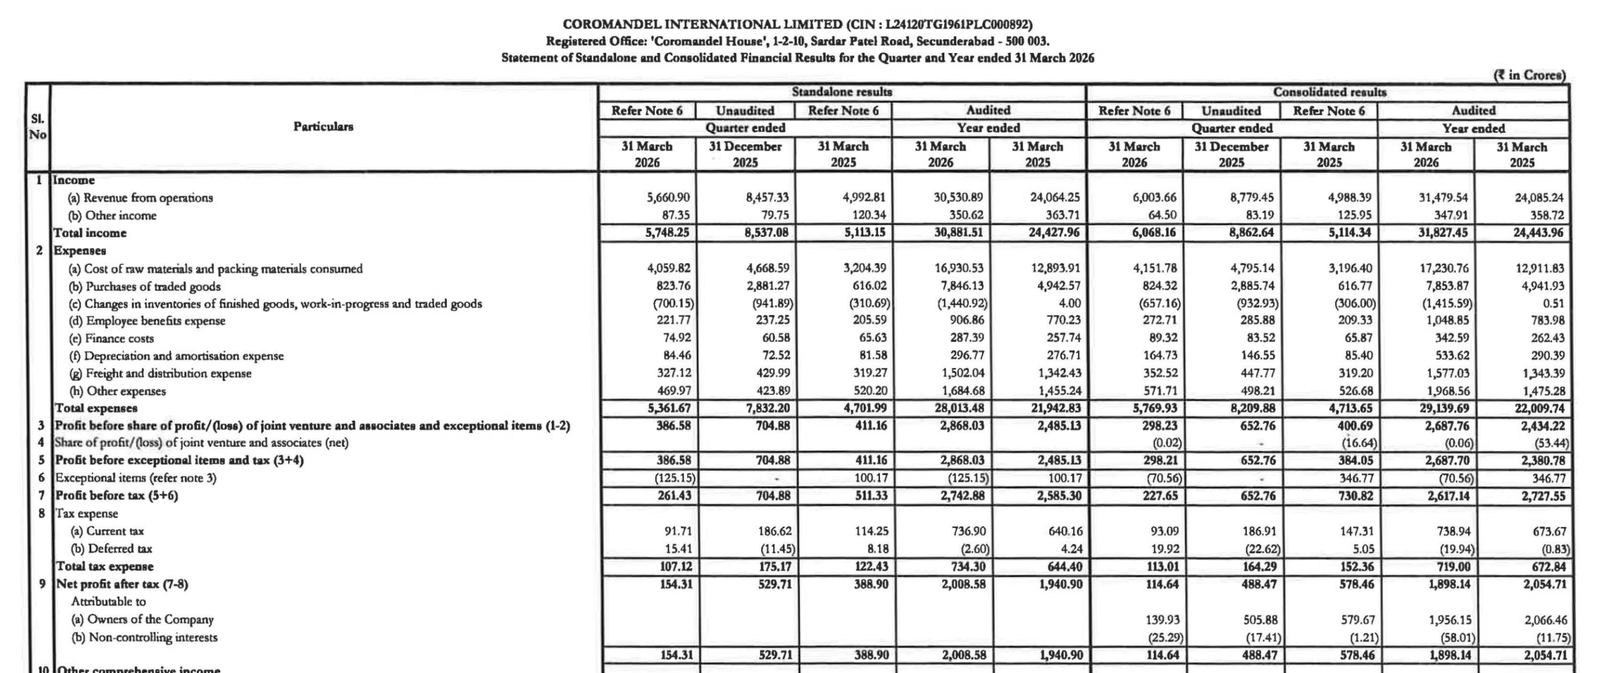
Coromandel International reported strong revenue growth in Q4 FY26, supported by higher nutrient and crop protection sales, but profitability declined sharply sequentially due to exceptional impairment charges and weaker operating leverage.
key financial highlights
- Revenue from Operations:
- Revenue (Q4 FY26): ₹6,003.66 Crores
- QoQ Change: -31.62%
- YoY Change: +20.35%
- Previous Quarter (Q3 FY26): ₹8,779.45 Crores
- Previous Year (Q4 FY25): ₹4,988.39 Crores
- Revenue (Q4 FY26): ₹6,003.66 Crores
- Profit After Tax (PAT):
- PAT (Q4 FY26): ₹114.64 Crores
- QoQ Change: -76.53%
- YoY Change: -80.18%
- Previous Quarter (Q3 FY26): ₹488.47 Crores
- Previous Year (Q4 FY25): ₹578.46 Crores
- PAT (Q4 FY26): ₹114.64 Crores
- QoQ Performance
- Revenue Trend: Sequential Decline
- Profit Trend: Profitability Weakened Significantly
Margin Analysis
Drivers:
- Sharp fall in quarterly revenue affected operating leverage.
- Employee expenses increased to ₹272.71 Cr versus ₹209.33 Cr YoY.
- Depreciation rose materially to ₹164.73 Cr from ₹85.40 Cr YoY.
- Freight and distribution expenses increased to ₹352.52 Cr.
- Exceptional impairment charge of ₹70.56 Cr impacted profitability.
- Crop protection margins weakened due to lower segment contribution.
Insight:
- Despite healthy annual growth, Q4 operating margins compressed materially because of higher fixed costs and impairment-related expenses.
Segment performance
Segments: Nutrient and Other Allied Business
- Revenue: ₹4,952.50 Cr
- Insights:
- Remained the largest contributor to overall revenue.
- Seasonal demand normalization impacted QoQ performance.
- Segment profit stood at ₹244.44 Cr.
Segments: Solar EPC & O&M
- Revenue: ₹1,076.25 Cr
- Insights:
- Strong YoY growth indicates improving crop protection demand.
- Segment remained relatively stable sequentially.
- Segment profit increased to ₹120.29 Cr from ₹101.11 Cr YoY.
Segment insight
Summary:
- Coromandel’s business mix remains heavily dependent on nutrient operations, while crop protection is emerging as a fast-growing secondary growth driver.
Charcateristics:
- Nutrient business contributes over 80% of revenue.
- Crop protection segment delivered stronger growth momentum.
- Diversification toward specialty products continues.
- Segment profitability remains cyclical and seasonally sensitive.
Earning quality check
Drivers:
- Operating cash flow remained positive at ₹1,557.54 Cr.
- Working capital pressure increased because inventories rose sharply.
- Inventory levels increased to ₹7,204.11 Cr from ₹4,769.91 Cr YoY.
- Trade receivables increased to ₹2,075.55 Cr.
- Exceptional impairment charges reduced reported earnings quality.
- Other income declined sharply YoY.
Interpretations:
- Core operations remain healthy, but earnings quality for the quarter was impacted by non-operational charges and working capital expansion.
balance sheet Analysis
- Total Assets: ₹24,503.43 Cr
- Total Liabilities: ₹11,370.25 Cr
Insight:
- The company maintained a strong balance sheet with healthy equity growth, though current liabilities and inventory levels increased materially due to business expansion and seasonal inventory build-up.
Additional Balance Sheet Signals:
- Total Equity increased to ₹13,133.18 Cr.
- Cash & cash equivalents improved to ₹422.53 Cr.
- Current borrowings increased to ₹786.86 Cr from ₹146.90 Cr YoY.
- Goodwill increased to ₹600.52 Cr, indicating acquisition-related expansion.
key risks
- Seasonal volatility in fertilizer demand.
- Rising inventory and receivable levels may pressure working capital.
- Dependence on government subsidy receivables.
- Higher freight and employee costs could pressure margins.
- Exposure to commodity price fluctuations.
- Exceptional impairment charges may continue impacting profitability if operational efficiencies weaken.
management strategy signals
Focus Area:
- Expanding crop protection business.
- Strengthening nutrient product portfolio.
- Improving integrated agri-solutions ecosystem.
- Capacity expansion and strategic investments.
- Enhancing operational efficiencies and distribution reach.
Financial metrics table
| Particular | Q4 FY26 | Q.O.Q | Y.O.Y |
|---|---|---|---|
| Revenue | ₹6,003.66 Crores | -31.62% | +20.35% |
| PBT | ₹227.65 Crores | -65.12% | -68.85% |
| PAT | ₹114.64 Crores | -76.53% | -80.18% |
Coromandel International delivered a strong annual operational performance with robust revenue growth and improving crop protection contribution.
However, Q4 FY26 profitability weakened sharply because of exceptional impairment charges, higher costs, and seasonal softness. Long-term fundamentals remain healthy due to strong balance sheet positioning, diversified agri-input operations, and strategic expansion initiatives, though near-term margin volatility and working capital pressure remain key monitorables.
Official Exchange Filing: Coromandel International Limited
Quarterly Performance Context
FISCAL YEAR
2025-2026
AUDIT STATUS
REVIEWED