Quarter Ended: March 2026
Lloyds Enterprises Limited – Q4 FY26 Results
NSE
LLOYDSENT
BSE
512463
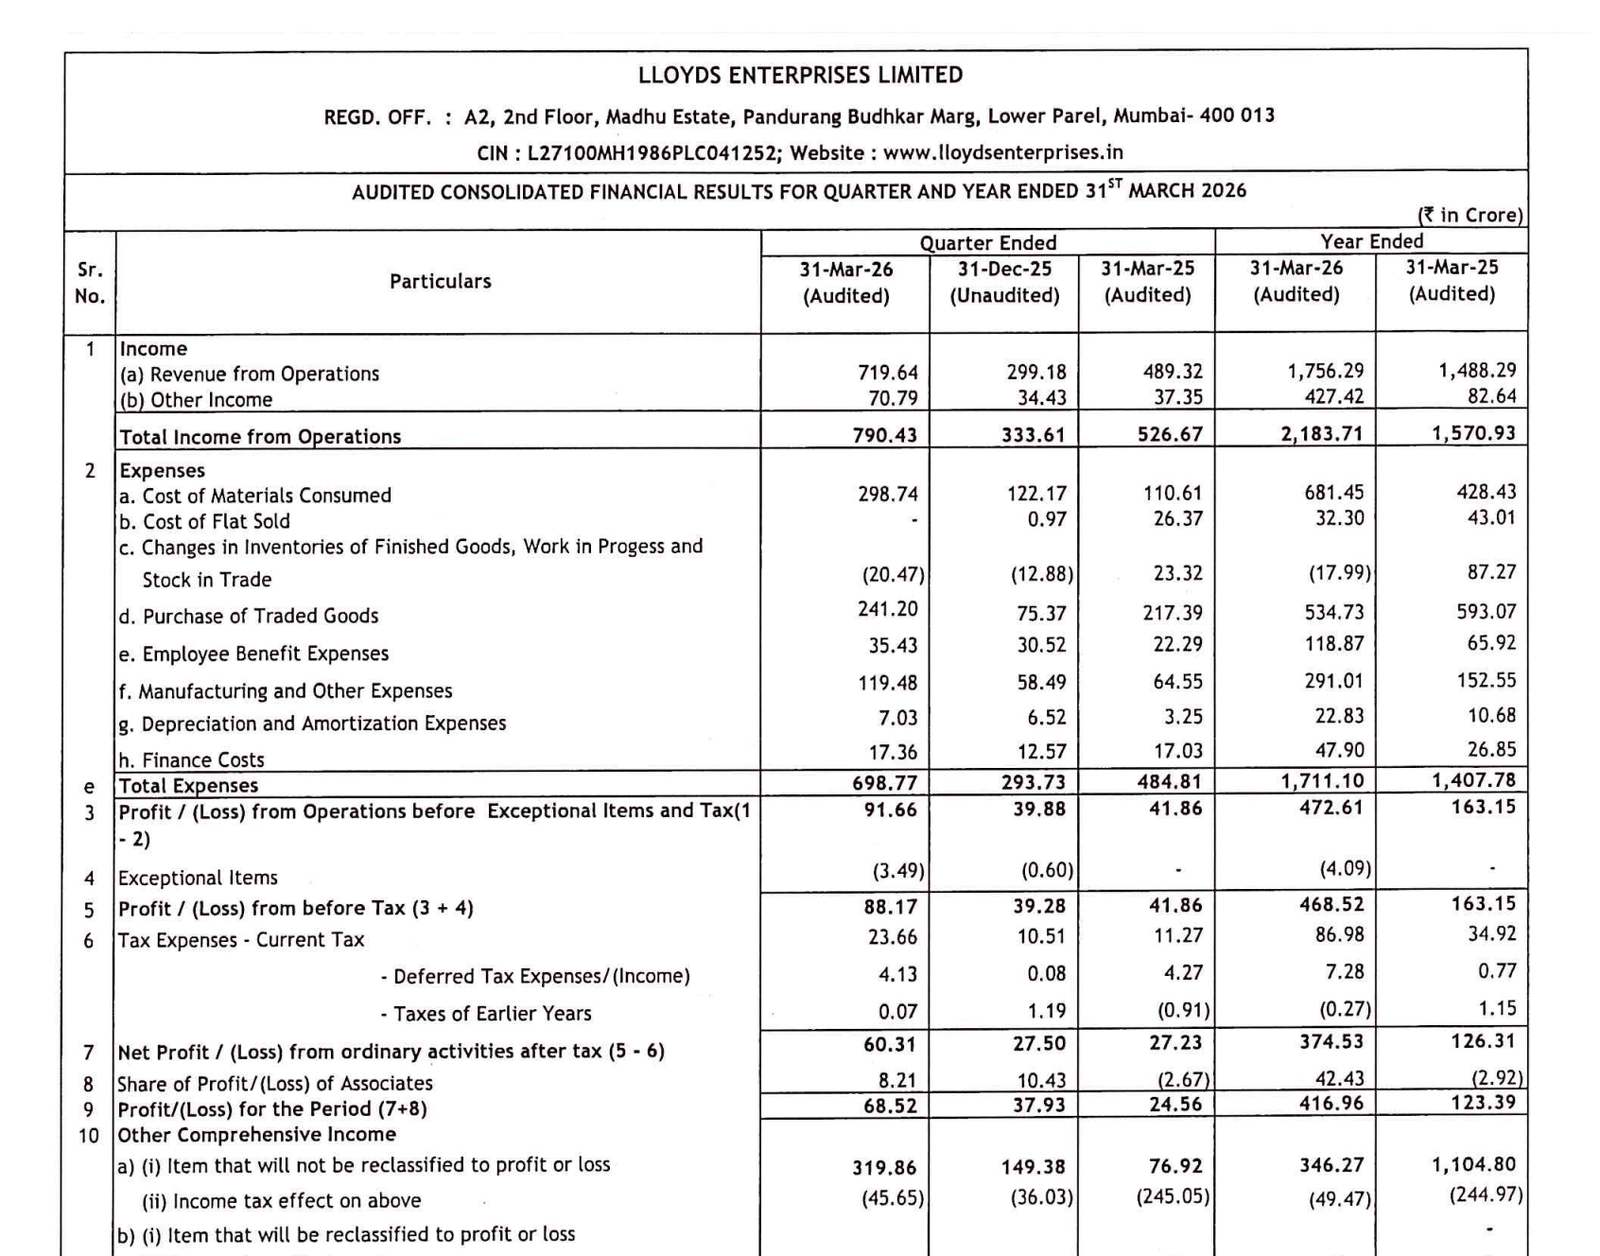
Lloyds Enterprises reported exceptional Q4 FY26 growth driven by strong expansion in Engineering and Steel businesses, with PAT nearly tripling YoY.
key financial highlights
- Revenue from Operations:
- Revenue (Q4 FY26): ₹719.64 Cr
- QoQ Change: +140.54%
- YoY Change: +47.07%
- Previous Quarter (Q3 FY26): ₹299.18 Cr
- Previous Year (Q4 FY25): ₹489.32 Cr
- Revenue (Q4 FY26): ₹719.64 Cr
- Profit After Tax (PAT):
- PAT (Q4 FY26): ₹68.52 Cr
- QoQ Change: +80.66%
- YoY Change: +178.99%
- Previous Quarter (Q3 FY26): ₹37.93 Cr
- Previous Year (Q4 FY25): ₹24.56 Cr
- PAT (Q4 FY26): ₹68.52 Cr
- QoQ Performance
- Revenue Trend: Strong Sequential Growth
- Profit Trend: Significant Sequential Improvement
Margin Analysis
Drivers:
- Higher Engineering segment contribution improved scale efficiency.
- Steel division profitability expanded sharply.
- Operating leverage improved despite higher costs.
- Finance costs remained manageable relative to revenue expansion.
- Manufacturing and operational expenses rose in line with scale growth.
Insight:
- Profitability expanded materially despite rapid business expansion and higher operating costs
Segment performance
Segments: Real Estate
- Revenue: ₹13.61 Cr
- Insights:
- Revenue declined sharply YoY
Segments: Steel
- Revenue: ₹273.02 Cr
- Insights:
- Strong profitability and stable scale growth
Segments: Engineering
- Revenue: ₹471.52 Cr
- Insights:
- Highest growth contributor with massive YoY expansion
Segments: Electrical
- Revenue: ₹69.85 Cr
- Insights:
- Steady operational growth
Segment insight
Summary:
- Engineering and Steel divisions emerged as the primary growth engines for Lloyds Enterprises during FY26.
Charcateristics:
- Engineering segment scaled aggressively.
- Steel segment delivered strong earnings growth.
- Real Estate contribution reduced significantly.
- Electrical business maintained stable growth trajectory.
- Business mix shifted toward industrial operations.
Earning quality check
Drivers:
- PAT growth exceeded revenue growth.
- Associate income contribution remained positive.
- Other comprehensive income strengthened overall earnings.
- Exceptional losses remained limited.
- Operating leverage improved materially.
Interpretations:
- Reported earnings quality remained healthy from a profitability perspective, although cash flow conversion weakened due to working capital deployment.
balance sheet Analysis
- Total Assets: ₹7,180.18 Cr
- Total Liabilities: ₹1,747.45 Cr
Insight:
- The balance sheet expanded aggressively during FY26 with major increases in Engineering and Steel assets, indicating large-scale business expansion.
key risks
- Negative operating cash flow.
- High working capital intensity.
- Capital-intensive expansion model.
- Dependence on external financing.
- Steel industry cyclicality.
- Execution risks from rapid scaling.
management strategy signals
Focus Area:
- Engineering business expansion.
- Steel capacity growth.
- Asset-led industrial scaling.
- Diversification across industrial verticals.
- Long-term infrastructure and manufacturing growth.
Financial metrics table
| Particular | Q4 FY26 | Q.O.Q | Y.O.Y |
|---|---|---|---|
| Revenue | ₹719.64 Crore | +140.54% | +47.07% |
| PBT | ₹88.17 Crore | +124.46% | +110.63% |
| PAT | ₹68.52 Crore | +80.66% | +178.99% |
Lloyds Enterprises delivered one of its strongest growth years with substantial improvement in revenue, profitability, and asset scale. Engineering and Steel businesses are clearly driving the next phase of expansion.
However, investors should closely monitor working capital management and operating cash flow sustainability as rapid expansion continues.
Official Exchange Filing: Lloyds Enterprises Limited
Quarterly Performance Context
FISCAL YEAR
2025-2026
AUDIT STATUS
REVIEWED