Quarter Ended: March 2026
GNA Axles Limited – Q4 FY26 Results
NSE
gna
BSE
540124
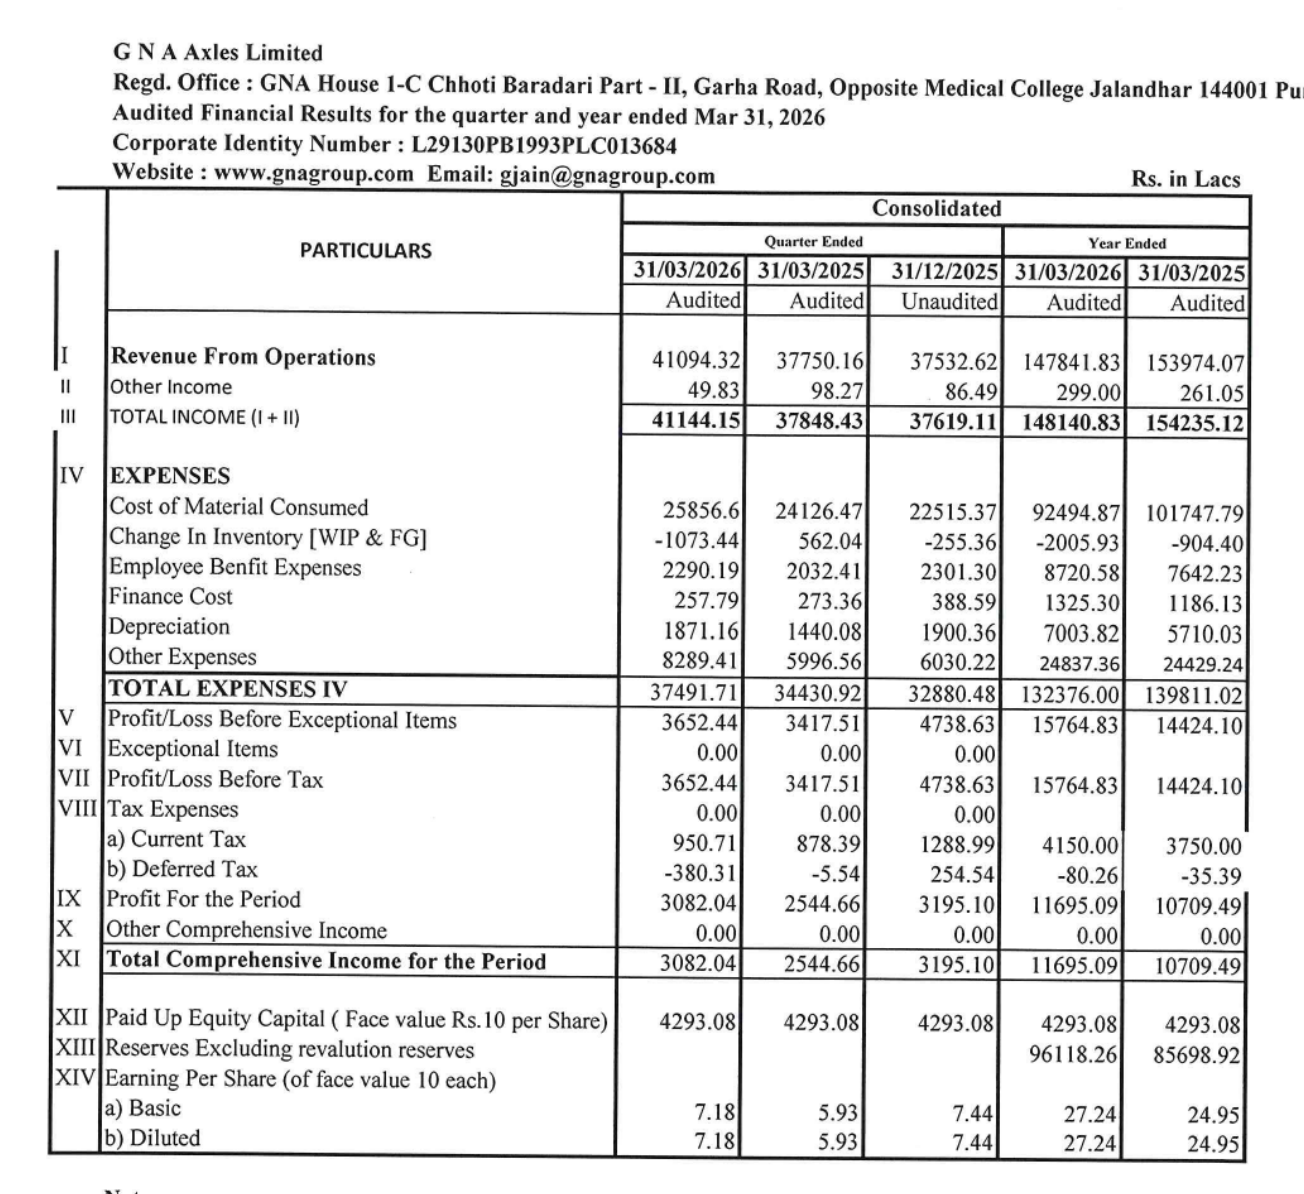
GNA Axles reported strong Q4 FY26 profitability growth with improved operational performance and margin expansion despite a decline in full-year revenue.
key financial highlights
- Revenue from Operations:
- Revenue (Q4 FY26): ₹41,094.32 Lakh
- QoQ Change: +9.49%
- YoY Change: +8.86%
- Previous Quarter (Q3 FY26): ₹37,532.62 Lakh
- Previous Year (Q4 FY25): ₹37,750.16 Lakh
- Revenue (Q4 FY26): ₹41,094.32 Lakh
- Profit After Tax (PAT):
- PAT (Q4 FY26): ₹3,082.04 Lakh
- QoQ Change: -3.54%
- YoY Change: +21.12%
- Previous Quarter (Q3 FY26): ₹3,195.10 Lakh
- Previous Year (Q4 FY25): ₹2,544.66 Lakh
- PAT (Q4 FY26): ₹3,082.04 Lakh
- QoQ Performance
- Revenue Trend: Revenue improved sharply on a sequential basis indicating stronger execution and demand recovery in the automotive axle segment.
- Profit Trend: Quarterly profits remained healthy despite marginal sequential moderation due to cost normalization.
Margin Analysis
Drivers:
- Better utilization levels improved operational leverage.
- Lower inventory adjustment impact supported margins.
- Finance costs declined sequentially.
- Employee and operational costs remained controlled.
- Higher depreciation due to capacity expansion investments.
Insight:
- The company demonstrated improved earnings efficiency despite challenging global automotive demand conditions.
Segment insight
Summary:
- GNA Axles continues focusing on automotive drivetrain components with strong exposure to export markets and commercial vehicle segments.
Charcateristics:
- Export-oriented auto component manufacturer.
- Capital-intensive engineering operations.
- Sensitive to global automotive demand cycles.
- Strong linkage with commercial vehicle production.
- Operational leverage-driven profitability model.
Earning quality check
Drivers:
- Strong operating cash flow generation.
- Stable profitability improvement.
- Higher depreciation due to capital expenditure.
- Increased inventory deployment.
- Reduction in trade receivables pressure.
Interpretations:
- Earnings quality remains healthy with strong cash generation from operations despite elevated capital expenditure activity.
balance sheet Analysis
- Total Assets: ₹1,52,021.04 Lakhs
- Total Liabilities: ₹42,045.78 Lakhs
Insight:
- The balance sheet strengthened with higher retained earnings and lower borrowings, although working capital deployment increased due to inventory accumulation and receivable management.
key risks
- Slowdown in global automotive demand.
- Export market volatility.
- Commodity price fluctuations.
- Currency movement risks.
- High capital expenditure commitments.
- Cyclicality in commercial vehicle industry.
management strategy signals
Focus Area:
- Capacity expansion.
- Export market penetration.
- Product diversification.
- Operational efficiency improvement.
- Working capital optimization.
Financial metrics table
| Particular | Q4 FY26 | Q.O.Q | Y.O.Y |
|---|---|---|---|
| Total Income | ₹41,144.15 Lakh | +9.37% | +8.71% |
| PBT | ₹3,652.44 Lakh | -22.92% | +6.87% |
| PAT | ₹3,082.04 Lakh | -3.54% | +21.12% |
GNA Axles delivered a healthy Q4 FY26 performance with strong quarterly revenue recovery and robust profitability growth. The company benefited from improved operational efficiency, export demand stability, and controlled finance costs.
Although annual revenue remained under pressure due to broader automotive sector challenges, the quarterly momentum indicates operational resilience and improving business conditions. Strong operating cash flows and reduced leverage further strengthen the company’s financial profile.
Official Exchange Filing: GNA Axles Limited
Quarterly Performance Context
FISCAL YEAR
2025-2026
AUDIT STATUS
REVIEWED