Quarter Ended: March 2026
Atul Ltd Q4 FY26 – Results Analysis
NSE
atul
BSE
500027
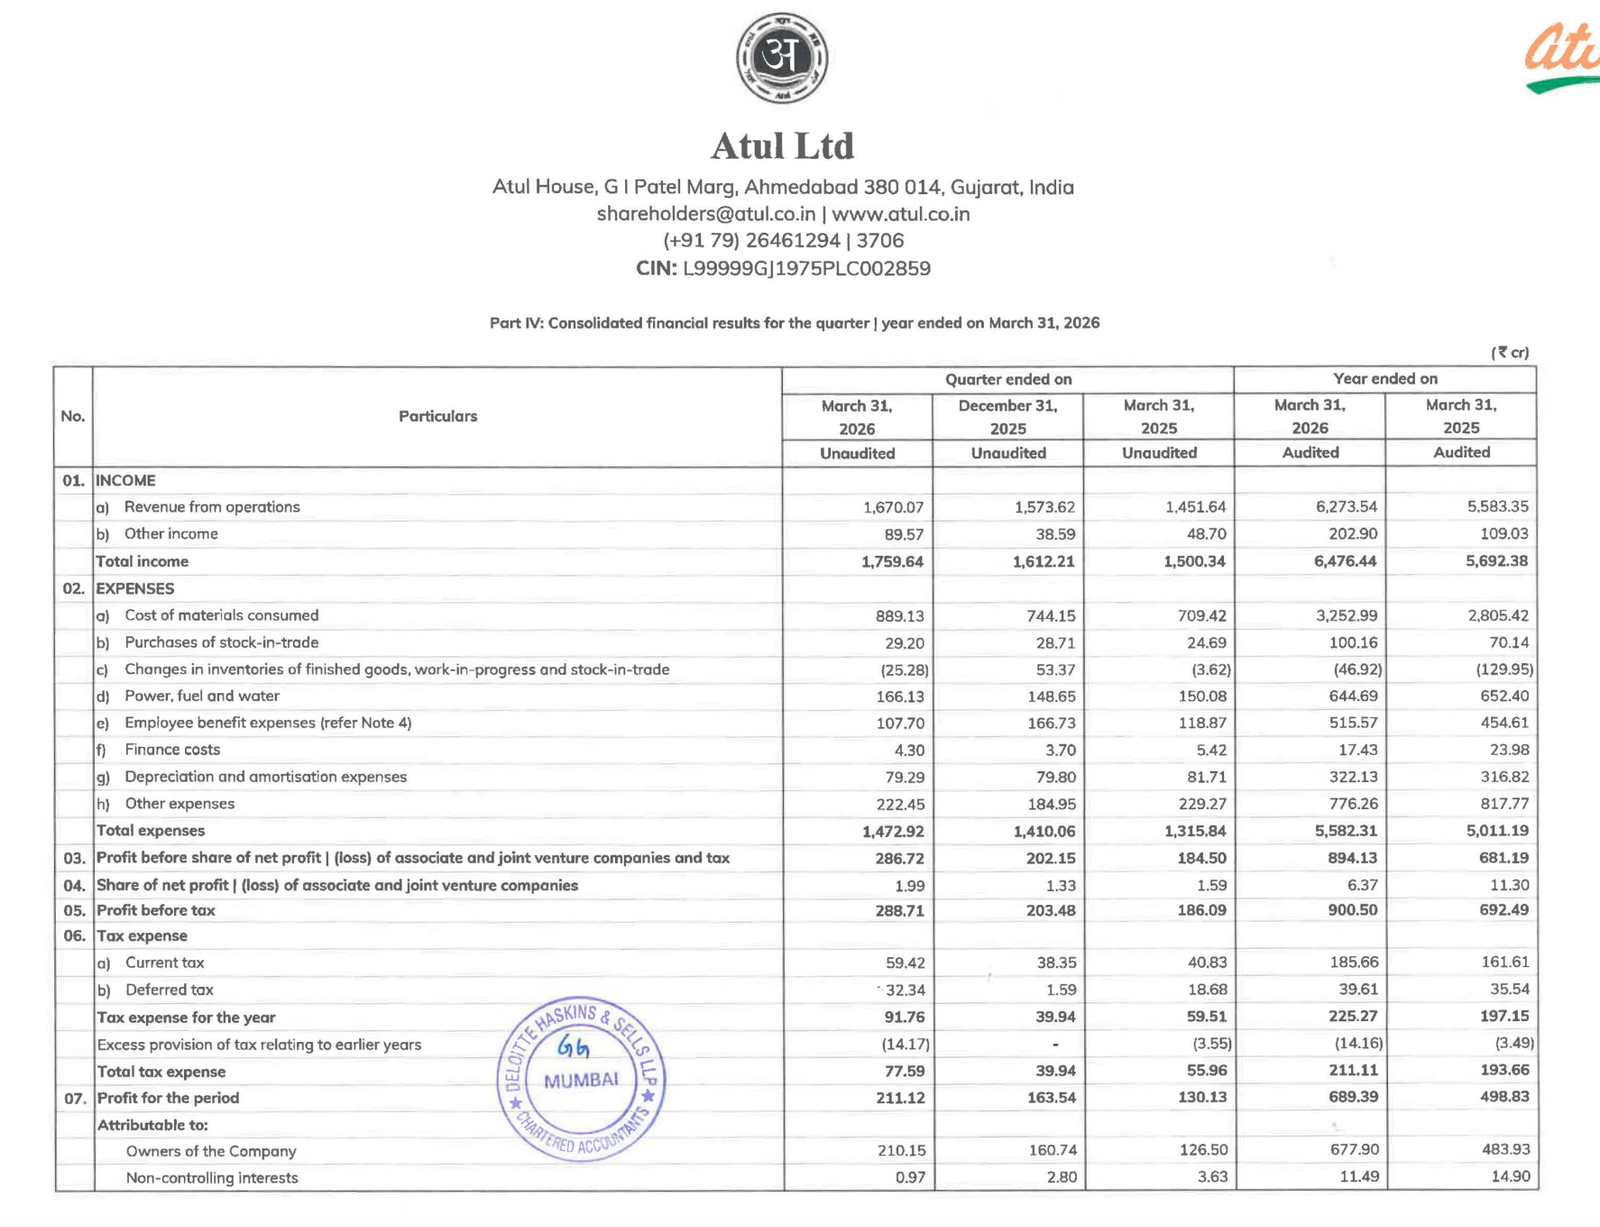
Atul Ltd delivered solid QoQ recovery in profitability with improving margins, while maintaining healthy YoY growth driven by specialty chemicals demand.
key financial highlights
- Revenue from Operations:
- Total Income (Q4 FY26): ₹1,759.64 Crore
- QoQ Growth: +9.07%
- YoY Growth: +17.28%
- Previous Quarter (Q3 FY26): ₹1,612.21 Crore
- Previous Year (Q4 FY25): ₹1,500.34 Crore
- Total Income (Q4 FY26): ₹1,759.64 Crore
- Profit After Tax (PAT):
- PAT (Q4 FY26): ₹211.12 Crore
- QoQ Growth: +29.10%
- YoY Growth: +62.23%
- Previous Quarter (Q3 FY26): ₹163.54 Crore
- Previous Year (Q4 FY25): ₹130.13 Crore
- PAT (Q4 FY26): ₹211.12 Crore
- Trend
- Revenue: Increasing
- Profit: Strong growth
Margin Analysis
Key Drivers:
- Better product mix (specialty chemicals)
- Improved operating leverage
- Stable raw material costs
Key Signal: Profit growth outpacing revenue indicates margin recovery phase underway
Segment insight
Business driven by:
- Life Science Chemicals
- Performance & Other Chemicals
Insights:
- Performance chemicals segment remains major revenue contributor
- Life science segment showing stable growth
Characteristics:
- Diversified chemical portfolio
- Export-oriented exposure
- Cyclical + specialty mix
Earning quality check
Drivers:
- Earnings backed by:
- Core operations
- Improved efficiency
- Supported by:
- Stable working capital
- Healthy operating cash flow (~₹1,022 Cr annually)
Interpretation:
- Earnings quality is high and sustainable
balance sheet Analysis
- Total Assets: ₹7,900.49 Crore
- Total Liabilities: ₹1,603.96 Crore
Insight:
- Strong equity base (~₹6,296 Crore)
- Low leverage
- Healthy liquidity position
key risks
- Raw material price volatility
- Global demand slowdown (exports)
- Chemical industry cyclicality
- Environmental/regulatory risks
management strategy signals
- Focus Areas:
- Specialty chemicals expansion
- Capacity utilization
- Cost efficiency
Financial Metrics
| Particular | Q4 FY26 | Q.O.Q | Y.O.Y |
|---|---|---|---|
| Total Income | ₹1,759.64 Crore | +9.07% | +17.28% |
| PBT | ₹288.71 Crore | +41.89% | +55.19% |
| PAT | ₹211.12 Crore | +29.10% | +62.23% |
Atul Ltd is showing strong recovery momentum with improving margins and stable growth. The business benefits from a diversified chemical portfolio and strong balance sheet, making it well-positioned for sustained growth.
Official Exchange Filing: Atul Ltd
Quarterly Performance Context
COST OF OPERATIONS AS % OF REVENUE
84%
NET PROFIT AS % OF REVENUE
12%
FISCAL YEAR
2025-2026
AUDIT STATUS
REVIEWED