Quarter Ended: March 2026
Newgen Software Technologies Limited – Q4 FY26 Results
NSE
newgen
BSE
540900
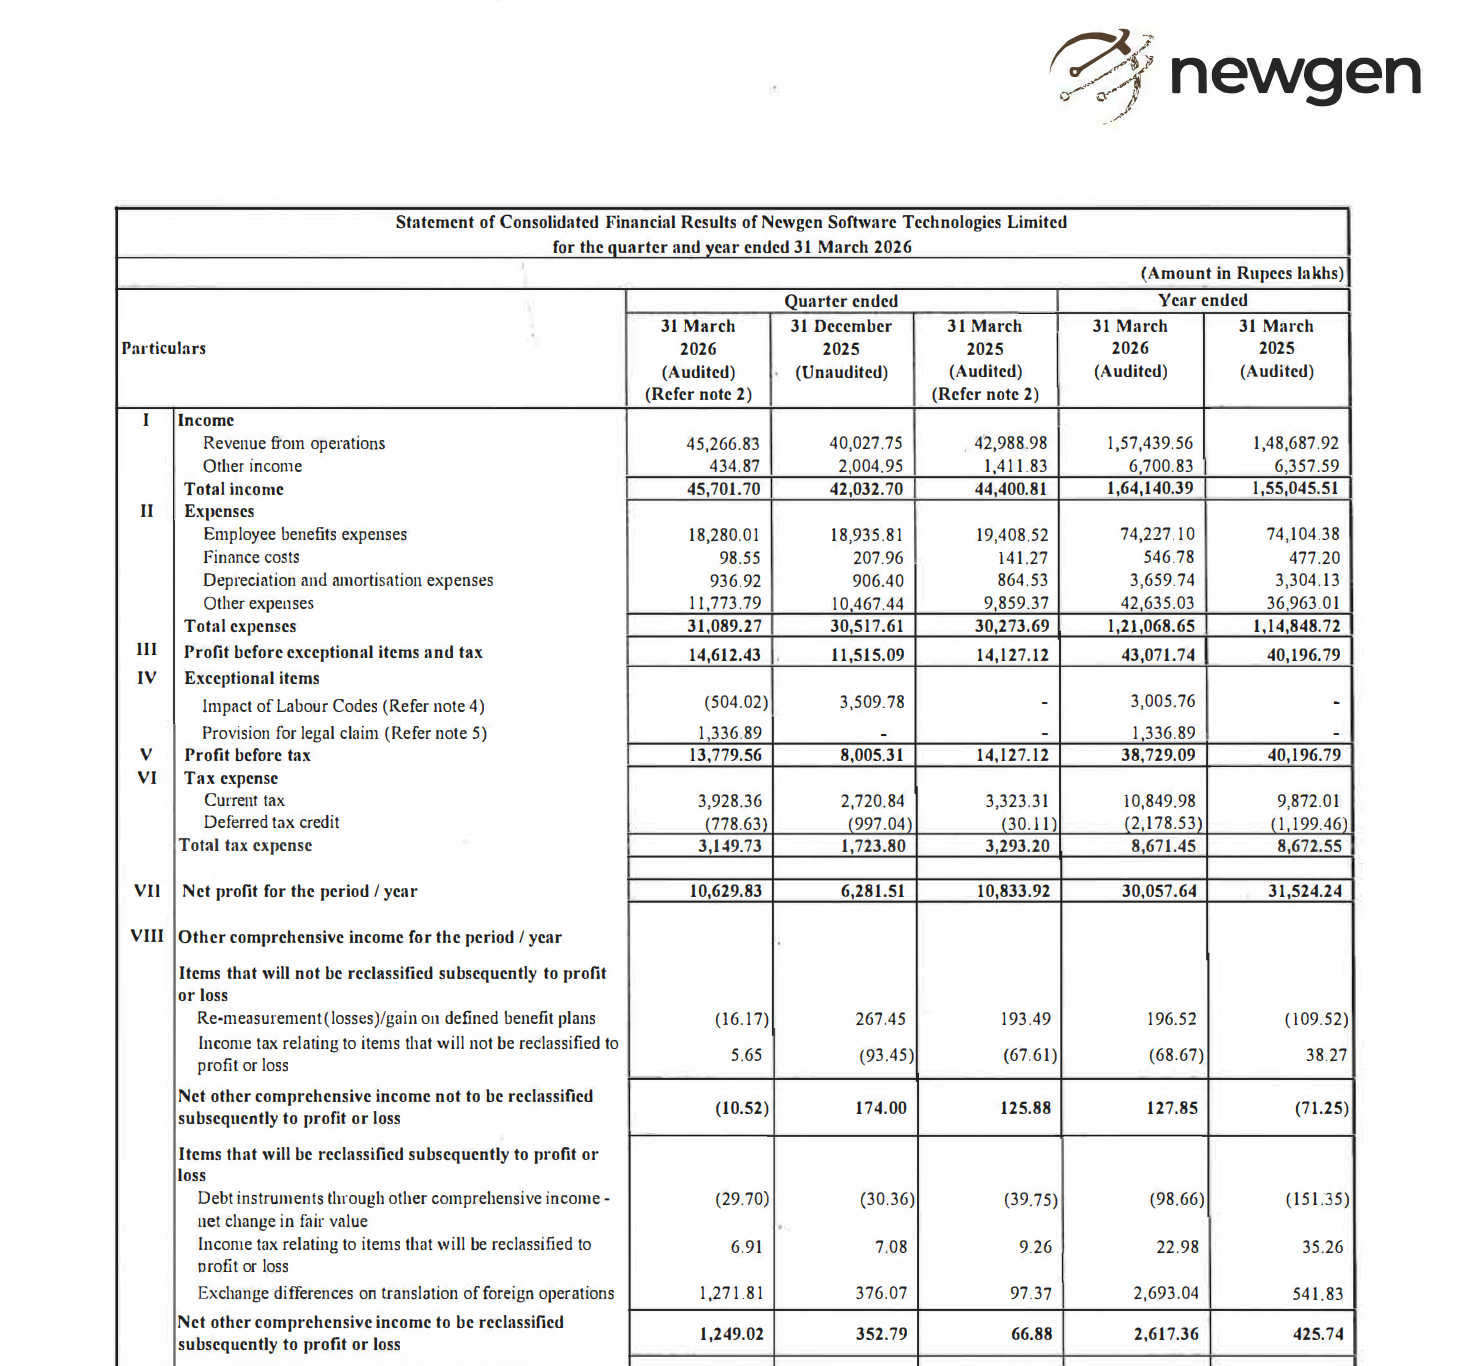
Newgen delivered strong top-line growth with improving operating leverage, though annual profit growth remained slightly subdued due to cost and provisioning factors
key financial highlights
- Revenue from Operations:
- Revenue (Q4 FY26): ₹4,526.68 Cr
- QoQ Change: +13.1%
- YoY Change: +5.3%
- Previous Quarter (Q3 FY26): ₹4,002.78 Cr
- Previous Year (Q4 FY25): ₹4,298.90 Cr
- Revenue (Q4 FY26): ₹4,526.68 Cr
- Profit After Tax (PAT):
- PAT (Q4 FY26): ₹1,062.98 Cr
- QoQ Change: +69.2%
- YoY Change: -1.9%
- Previous Quarter (Q3 FY26): ₹628.15 Cr
- Previous Year (Q4 FY25): ₹1,083.39 Cr
- PAT (Q4 FY26): ₹1,062.98 Cr
- QoQ Performance
- Revenue Trend: Strong Growth
- Profit Trend: Sharp Recovery
Margin Analysis
Key Drivers:
- Improved operating leverage (revenue growth outpacing expenses)
- Controlled employee cost growth
- Lower finance costs QoQ
- Provisioning and legal expenses impacting yearly comparison
Key Signal: Margins are expanding QoQ, indicating strong execution in core operations
Segment performance
Segment (Geographical): India
- Revenue: ₹12,437.87 lakh
- Insights:
- Stable core market
- Moderate growth
Segment: EMEA
- Revenue: ₹13,756.09 lakh
- Insights:
- Strong contributor
- Key growth geography
Segment: APAC
- Revenue: ₹8,460.44 lakh
- Insights:
- Emerging growth region
Segment: USA
- Revenue: ₹10,612.43 lakh
- Insights:
- High-value contracts
- Margin supportive
Segment insight
Summary:
- Newgen operates as a global enterprise software provider, with diversified geographical revenue streams
Characteristics:
- Recurring SaaS-like revenue model
- Export-driven growth
- High margin software business
Earning quality check
Drivers:
- Core operating cash flow strong (₹23,185 Cr)
- Minimal reliance on exceptional items
- Some provisioning and legal claim impact
Interpretation:
- Earnings quality is high, supported by strong operating cash flows and recurring revenue
balance sheet Analysis
- Total Assets: ₹24,424.75 Cr
- Total Liabilities: ₹6,651.25 Cr
Insight:
- Strong net cash position (~₹10,353 Cr cash)
- High reserves (~₹16,361 Cr)
- Low leverage → strong financial stability
key risks
- High receivables growth (working capital pressure)
- Currency fluctuation impact
- Dependency on global IT spending
- Deal execution risks
management strategy signals
Focus Area:
- Global expansion (EMEA & US)
- SaaS platform scaling
- Enterprise client acquisition
- Digital transformation solutions
Financial Metrics
| Particular | Q4 FY26 | Q.O.Q | Y.O.Y |
|---|---|---|---|
| Total Income | ₹4,570.17 Crore | +12.7% | +3.9% |
| PBT | ₹1,377.96 Crore | +72.0% | -2.4% |
| PAT | ₹1,062.98 Crore | +69.2% | -1.9% |
Newgen delivered a strong operational quarter with improving margins and global growth traction. While YoY profit remained flat due to cost factors, the underlying business momentum is intact. The company stands out as a high-quality IT growth play with strong cash flows and global exposure.
Official Exchange Filing: Newgen Software Technologies Limited
Quarterly Performance Context
FISCAL YEAR
2025-2026
AUDIT STATUS
REVIEWED