Quarter Ended: March 2026
Sona BLW Precision Forgings – Q4 FY26 Results
NSE
sonacoms
BSE
543300
Company delivered solid YoY growth with improving scale, supported by strong demand in EV components and global OEM exposure
key financial highlights
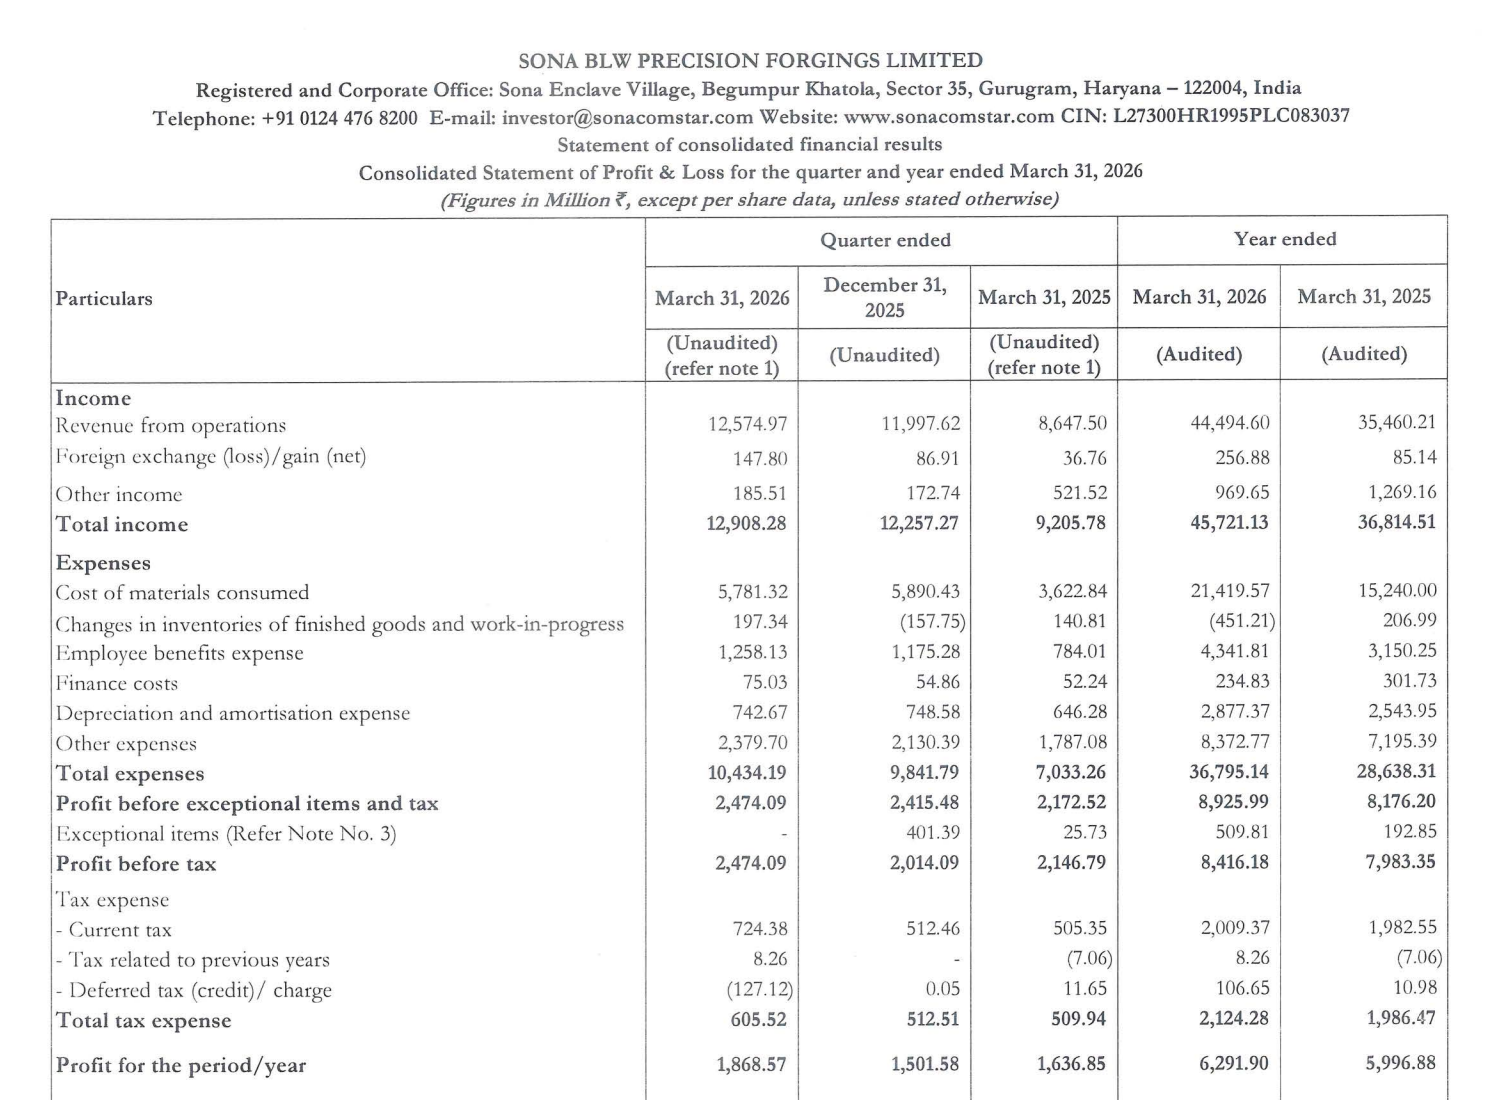
- Revenue from Operations:
- Total Income (Q4 FY26): ₹12,908.28 Million
- QoQ Change: +5.31%
- YoY Change: +40.21%
- Previous Quarter (Q3 FY26): ₹12,257.27 Million
- Previous Year (Q4 FY25): ₹9,205.78 Million
- Total Income (Q4 FY26): ₹12,908.28 Million
- Profit After Tax (PAT):
- PAT (Q4 FY26): ₹1,868.57 Million
- QoQ Change: +24.45%
- YoY Change: +14.16%
- Previous Quarter (Q3 FY26): ₹1,501.58 Million
- Previous Year (Q4 FY25): ₹1,636.85 Million
- PAT (Q4 FY26): ₹1,868.57 Million
- QoQ Performance
- Revenue Trend: Growth
- Profit Trend: Strong Growth
Margin Analysis
Drivers:
- Operating leverage from higher volumes
- Stable cost structure despite raw material pressure
- Improved mix towards EV components
Insight:
- Margins remain resilient despite scale-up, indicating strong operational efficiency
Segment insight
Summary:
- Sona BLW operates as a global automotive technology supplier, heavily aligned with EV ecosystem.
Charcateristics:
- High exposure to electric vehicle components
- Global OEM client base
- Technology-driven product portfolio
Earning quality check
Drivers:
- Core operating profit driving growth
- Limited dependence on other income
- Consistent EBITDA expansion
Interpretations:
- Earnings quality is high, driven by strong core business performance
balance sheet Analysis
- Total Assets: ₹74,638.63 Mn
- Total Liabilities: ₹13,316.98 Mn
Insight:
- Strong equity base (~₹61,321 Mn)
- Low leverage → healthy financial structure
- Cash flow remains robust despite capex
key risks
- Dependence on global auto cycle
- EV transition uncertainty
- Currency fluctuations
- Client concentration risk
management strategy signals
Focus Area:
- Expansion in EV drivetrain components
- Strengthening global OEM partnerships
- Capacity expansion and technology investments
Financial metrics table
| Particular | Q4 FY26 | Q.O.Q | Y.O.Y |
|---|---|---|---|
| Total Income | ₹12,908.28 Million | +5.31% | +40.21% |
| PBT | ₹2,474.09 Million | +22.85% | +15.24% |
| PAT | ₹1,868.57 Million | +24.45% | +14.16% |
Sona BLW continues to deliver consistent growth with strong execution, supported by EV tailwinds. The business shows high-quality earnings and strong scalability, making it structurally positive.
Official Exchange Filing: Sona BLW Precision Forgings Limited
Quarterly Performance Context
COST OF OPERATIONS AS % OF REVENUE
81%
NET PROFIT AS % OF REVENUE
14%
FISCAL YEAR
2025-2026
AUDIT STATUS
REVIEWED