Quarter Ended: March 2026
Emcure Pharmaceuticals – Q4 FY26 Results
NSE
emcure
BSE
544210
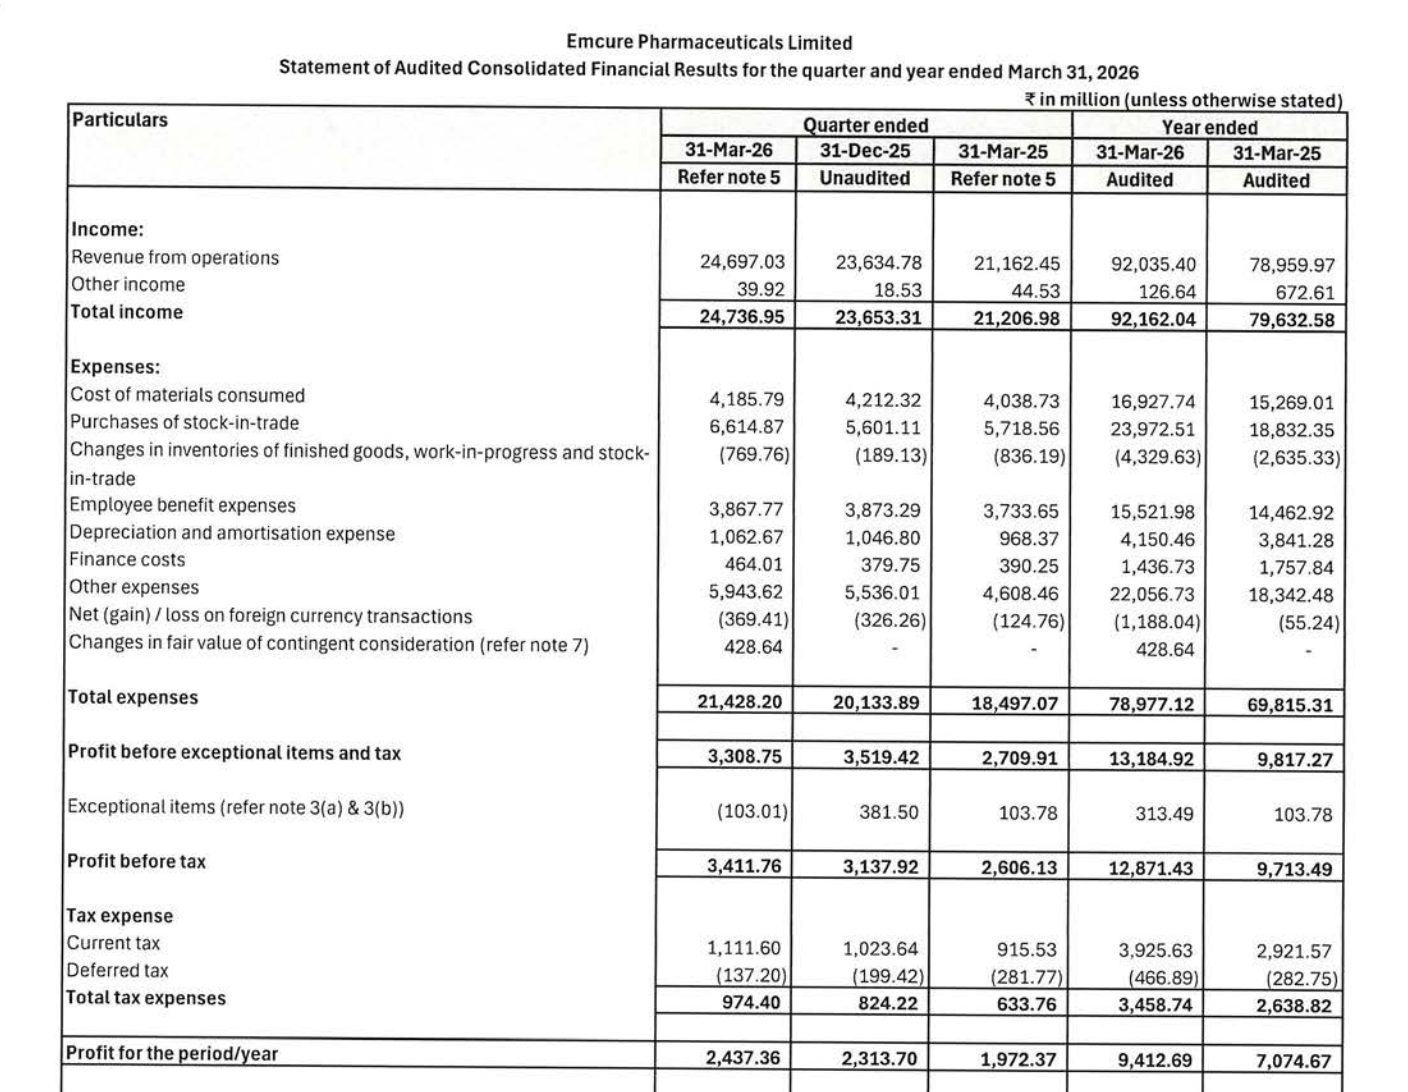
Emcure delivered solid revenue growth both YoY and QoQ, but profit growth remained moderate due to cost pressures and exceptional adjustments impacting margins.
key financial highlights
- Revenue from Operations:
- Total Income (Q4 FY26): ₹24,697.03 Million
- QoQ Change: +4.49%
- YoY Change: +16.70%
- Previous Quarter (Q3 FY26): ₹23,634.78 Million
- Previous Year (Q4 FY25): ₹21,162.45 Million
- Total Income (Q4 FY26): ₹24,697.03 Million
- Profit After Tax (PAT):
- PAT (Q4 FY26): ₹2,437.36 Million
- QoQ Change: +5.34%
- YoY Change: +23.57%
- Previous Quarter (Q3 FY26): ₹2,313.70 Million
- Previous Year (Q4 FY25): ₹1,972.37 Million
- PAT (Q4 FY26): ₹2,437.36 Million
- QoQ Performance
- Revenue Trend: Moderate Growth
- Profit Trend: Stable Growth
Margin Analysis
Drivers:
- Increase in employee benefit expenses
- Higher other operating expenses
- Inventory adjustments impacting cost structure
- Exceptional item impact in current quarter
Insight:
- Revenue growth is strong, but margin expansion is limited due to rising operational costs
Earning quality check
Drivers:
- Strong core operating revenue growth
- Impact of exceptional items (negative in current quarter)
- Increase in depreciation and finance costs
- Forex gains partially supporting earnings
Interpretations:
- Earnings quality is moderate — growth is driven by operations, but profitability is influenced by one-offs and cost pressures
balance sheet Analysis
- Total Assets: ₹96,124.81 Mn
- Total Liabilities: ₹46,358.08 Mn
Insight:
- The company shows asset expansion with a noticeable increase in current liabilities, indicating working capital intensity and possible leverage increase
key risks
- Rising operating costs impacting margins
- Increasing short-term borrowings
- High working capital requirements
- Dependence on inventory and receivables cycle
management strategy signals
Focus Area:
- Capacity expansion through capital expenditure
- Investment in intangible assets and product development
- Strengthening domestic and export markets
- Managing working capital cycle
Financial metrics table
| Particular | Q4 FY26 | Q.O.Q | Y.O.Y |
|---|---|---|---|
| Total Income | ₹24,697.03 Million | +4.49% | +111.0% |
| EBITDA | ₹3,268.83 Million | – | – |
| PAT | ₹2,437.36 Million | +5.34% | +23.57% |
Emcure Pharmaceuticals continues to demonstrate strong revenue momentum, but margin pressure and rising costs remain key concerns. The company is in an expansion phase, which supports long-term growth but may keep profitability volatile in the near term
Official Exchange Filing: Emcure Pharmaceuticals Limited
Quarterly Performance Context
COST OF OPERATIONS AS % OF REVENUE
87%
NET PROFIT AS % OF REVENUE
10%
FISCAL YEAR
2025-2026
AUDIT STATUS
REVIEWED