Quarter Ended: March 2026
Ajanta Pharma – Q4 FY26 Results
NSE
ajantpharm
BSE
532331
Ajanta Pharma delivered strong margin expansion and consistent profitability growth despite moderate revenue growth, indicating operational efficiency improvement.
key financial highlights
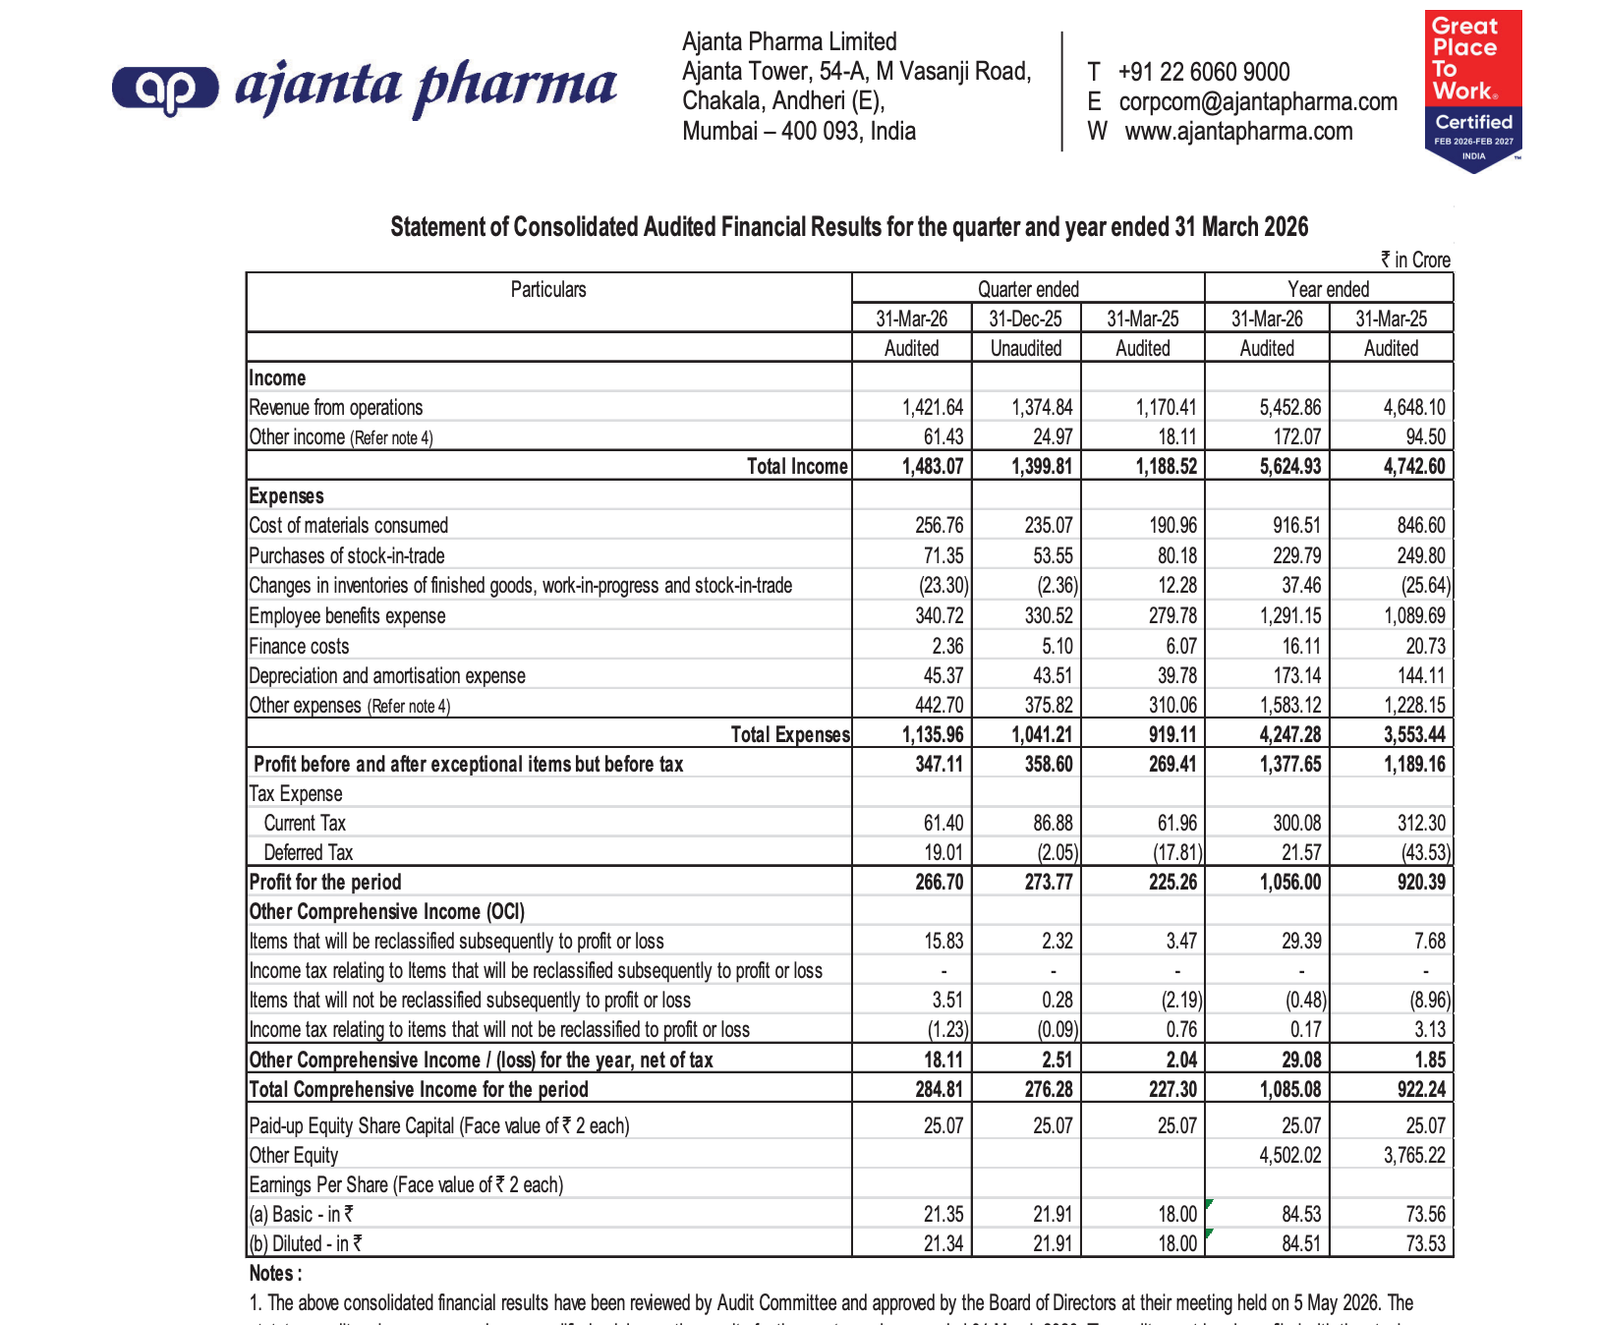
- Revenue from Operations:
- Total Income (Q4 FY26): ₹1,421.64 Crore
- QoQ Change: +3.40%
- YoY Change: +21.46%
- Previous Quarter (Q3 FY26): ₹1,374.84 Crore
- Previous Year (Q4 FY25): ₹1,170.41 Crore
- Total Income (Q4 FY26): ₹1,421.64 Crore
- Profit After Tax (PAT):
- PAT (Q4 FY26): ₹266.70 Crore
- QoQ Change: -2.58%
- YoY Change: +18.35%
- Previous Quarter (Q3 FY26): ₹273.77 Crore
- Previous Year (Q4 FY25): ₹225.26 Crore
- PAT (Q4 FY26): ₹266.70 Crore
- QoQ Performance
- Revenue Trend: Stable Growth
- Profit Trend: Slight Decline
Margin Analysis
Drivers:
- Controlled raw material costs
- Lower finance cost
- Improved operating leverage
- Stable employee cost structure
Insight:
- Margins improved despite slight QoQ profit dip, indicating strong cost control and efficient operations
Segment insight
Summary:
- Company operates in a single segment – Pharmaceuticals
Charcateristics:
- Branded generics focus
- Strong export presence
- Specialty product portfolio
Earning quality check
Drivers:
- Core operating profit driven growth
- Minimal exceptional impact
- Stable depreciation and finance costs
- Controlled working capital
Interpretations:
- High-quality earnings supported by core operations with limited reliance on one-off items
balance sheet Analysis
- Total Assets: ₹6,154.84 Cr
- Total Liabilities: ₹1,627.75 Cr
Insight:
- Strong balance sheet with low leverage and high equity base, indicating financial stability
key risks
- Currency fluctuations impacting export earnings
- Pricing pressure in pharma markets
- Regulatory risks in international markets
- Dependency on key product segments
management strategy signals
Focus Area:
- Expansion in export markets
- Strengthening branded generics portfolio
- Cost efficiency and margin improvement
- Investment in product pipeline
Financial metrics table
| Particular | Q4 FY26 | Q.O.Q | Y.O.Y |
|---|---|---|---|
| Total Income | ₹1,421.64 Crore | +3.40% | +21.46% |
| EBIT | ₹347.11 Crore | -3.20% | +28.83% |
| PAT | ₹266.70 Crore | -2.58% | +18.35% |
Ajanta Pharma showcases strong operational efficiency with consistent profitability and margin strength. While revenue growth remains moderate, the company’s disciplined cost structure and strong balance sheet make it a fundamentally stable player.
Official Exchange Filing: Ajanta Pharma Limited
Quarterly Performance Context
COST OF OPERATIONS AS % OF REVENUE
80%
NET PROFIT AS % OF REVENUE
19%
FISCAL YEAR
2025-2026
AUDIT STATUS
REVIEWED