Quarter Ended: March 2026
Strides Pharma Science Limited – Q4 FY26 Results
NSE
star
BSE
532531
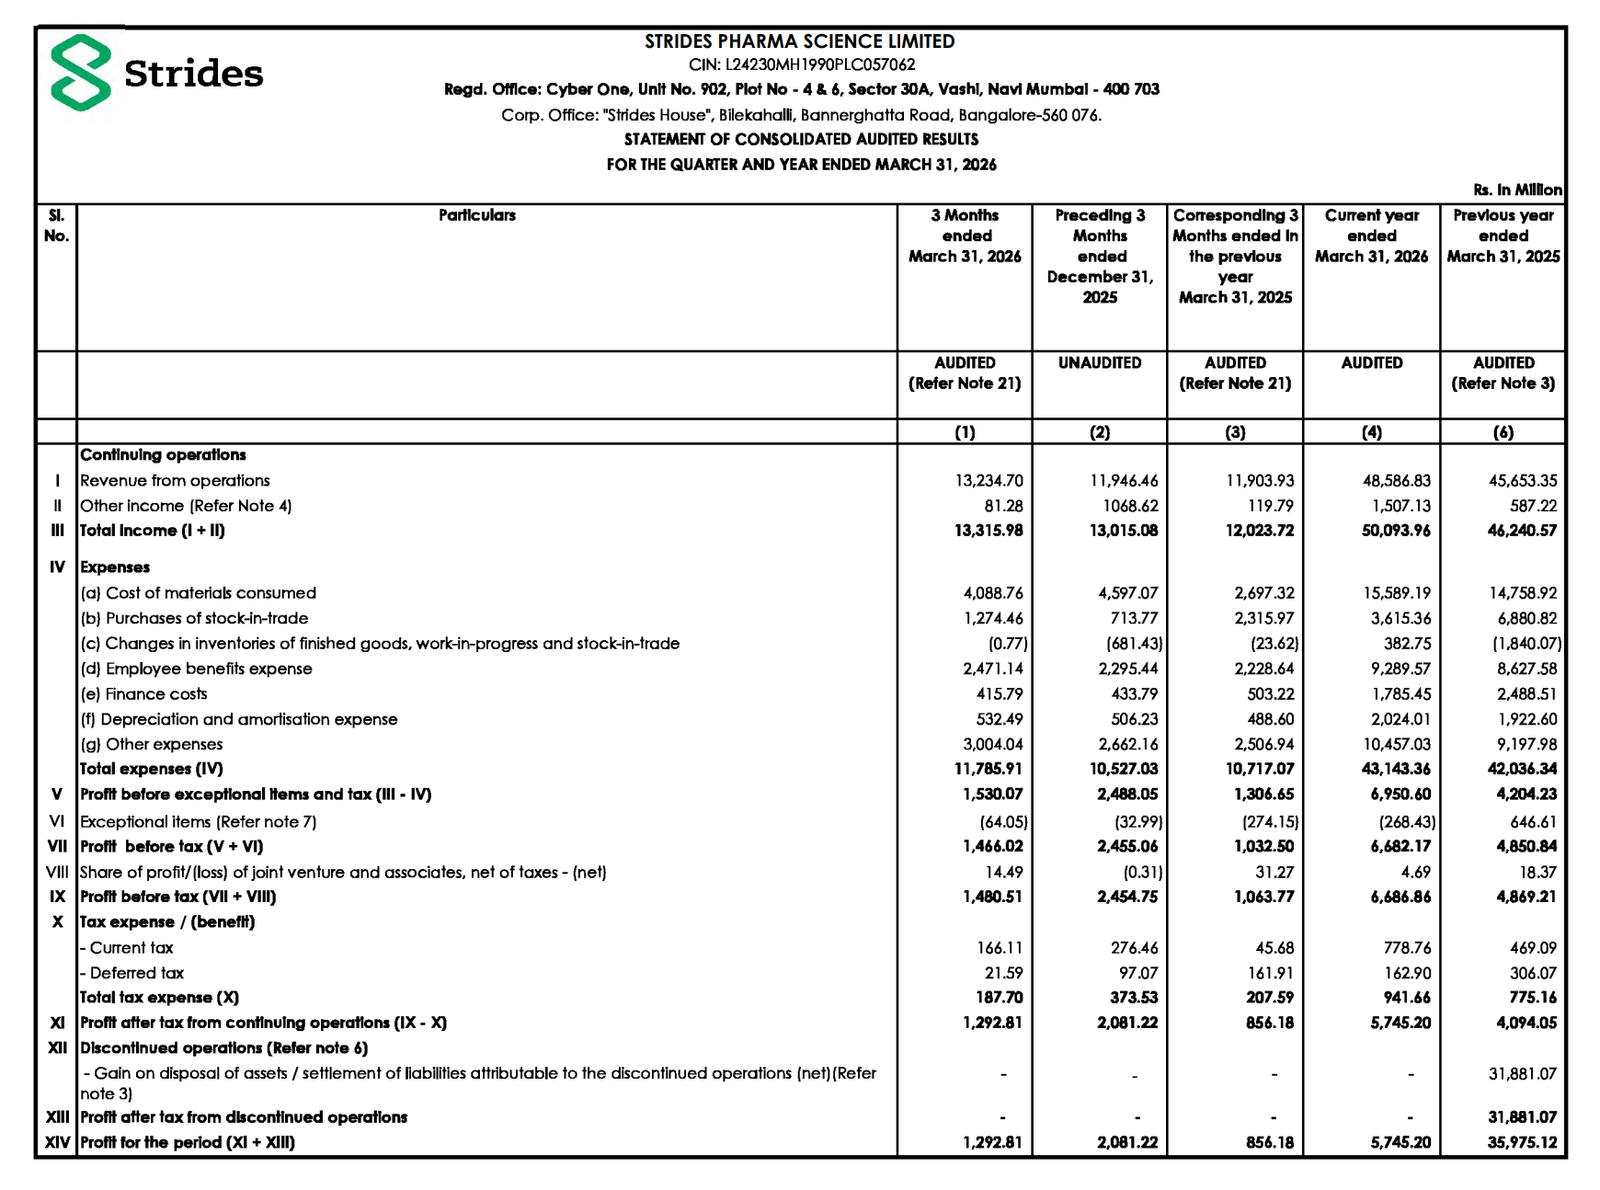
Strides Pharma Science reported strong FY26 earnings growth supported by higher operating income, improved profitability, and continued balance sheet strengthening.
key financial highlights
- Revenue from Operations:
- Revenue (Q4 FY26): ₹1,323.47 crore
- QoQ Change: +10.8%
- YoY Change: +11.2%
- Previous Quarter (Q3 FY26): ₹1,194.65 crore
- Previous Year (Q4 FY25): ₹1,190.39 crore
- Revenue (Q4 FY26): ₹1,323.47 crore
- Profit After Tax (PAT):
- PAT (Q4 FY26): ₹129.28 crore
- QoQ Change: -37.9%
- YoY Change:+51.0%
- Previous Quarter (Q3 FY26): ₹208.12 crore
- Previous Year (Q4 FY25): ₹85.62 crore
- PAT (Q4 FY26): ₹129.28 crore
- QoQ Performance:
- Revenue:
- Revenue growth remained healthy across key pharmaceutical operations.
- Sequential growth was supported by improved product mix and operational execution.
- Annual revenue crossed ₹4,858.68 crore.
- Profit:
- Quarterly profitability moderated sequentially after a strong Q3.
- YoY profitability improved sharply due to operational efficiency and lower exceptional impact.
- FY26 PAT rose strongly to ₹574.52 crore.
- Revenue:
Margin Analysis
Drivers:
- Gross profitability improved due to better product mix.
- Finance costs reduced significantly on a yearly basis.
- Employee expenses increased due to operational scaling.
- Other expenses remained elevated due to business expansion activities.
- Inventory adjustments positively supported margins.
Insight:
- The company demonstrated meaningful operating leverage and profitability recovery despite elevated financing and compliance costs.
Segment insight
Business Summary:
Strides Pharma continues to focus on regulated pharmaceutical markets with emphasis on operational efficiency, manufacturing scale, and balance sheet repair.
Key Characteristics:
- Export-oriented pharmaceutical business model.
- Strong focus on regulated generics markets.
- Deleveraging-driven financial strategy.
- Improving operational cash generation profile.
Earning quality check
Key Drivers:
- Net cash generated from operating activities improved to ₹702.52 crore.
- Operating profit before working capital changes increased strongly.
- Working capital pressures persisted due to inventories and receivables.
- Interest costs declined materially YoY.
- Exceptional losses reduced significantly versus previous year.
Interpretations:
- Earnings quality improved materially during FY26 as operational cash generation strengthened and debt servicing burden reduced.
balance sheet Analysis
- Total Assets: ₹6,927.23 crore
- Total Liabilities: ₹3,777.90 crore
Insight:
- Equity base strengthened materially due to profit growth.
- Cash and cash equivalents improved sharply to ₹188.70 crore.
- Borrowings reduced compared with prior year.
- Current assets increased due to inventory expansion and receivable growth.
key risks
- Regulatory risks in global pharmaceutical markets.
- Pricing pressure in generics business.
- Working capital intensity remains elevated.
- Currency fluctuations can impact export profitability.
- Dependence on regulated market approvals.
management strategy signals
Focus Area:
- Continued debt reduction and deleveraging.
- Improving profitability through product mix optimization.
- Strengthening regulated market presence.
- Expanding manufacturing efficiency.
- Enhancing cash flow generation.
Financial metrics table
| Particular | Q4 FY26 | Q.O.Q | Y.O.Y |
|---|---|---|---|
| Total Income | ₹1,331.60 Crore | +2.3% | +10.8% |
| PBT | ₹148.05 Crore | -39.7% | +39.2% |
| PAT | ₹129.28 Crore | -37.9% | +51.0% |
Strides Pharma Science delivered a strong FY26 performance with healthy revenue growth, sharp improvement in annual profitability, and significantly stronger operating cash flow generation. The company continued improving its balance sheet through deleveraging and operational discipline. While quarterly profit moderated sequentially, the broader financial trajectory remains positive with improving earnings quality and stronger liquidity position.
Official Exchange Filing: Strides Pharma Science Limited
Quarterly Performance Context
FISCAL YEAR
2025-2026
AUDIT STATUS
REVIEWED