
Quarter Ended: March 2026
Divi’s Laboratories Limited – Q4 FY26 Results
NSE
divislab
BSE
532488
Divi’s Laboratories reported a strong Q4 FY26 performance with robust revenue growth, margin expansion, and healthy profit growth supported by operational efficiency and improved product demand.
key financial highlights
- Revenue from Operations:
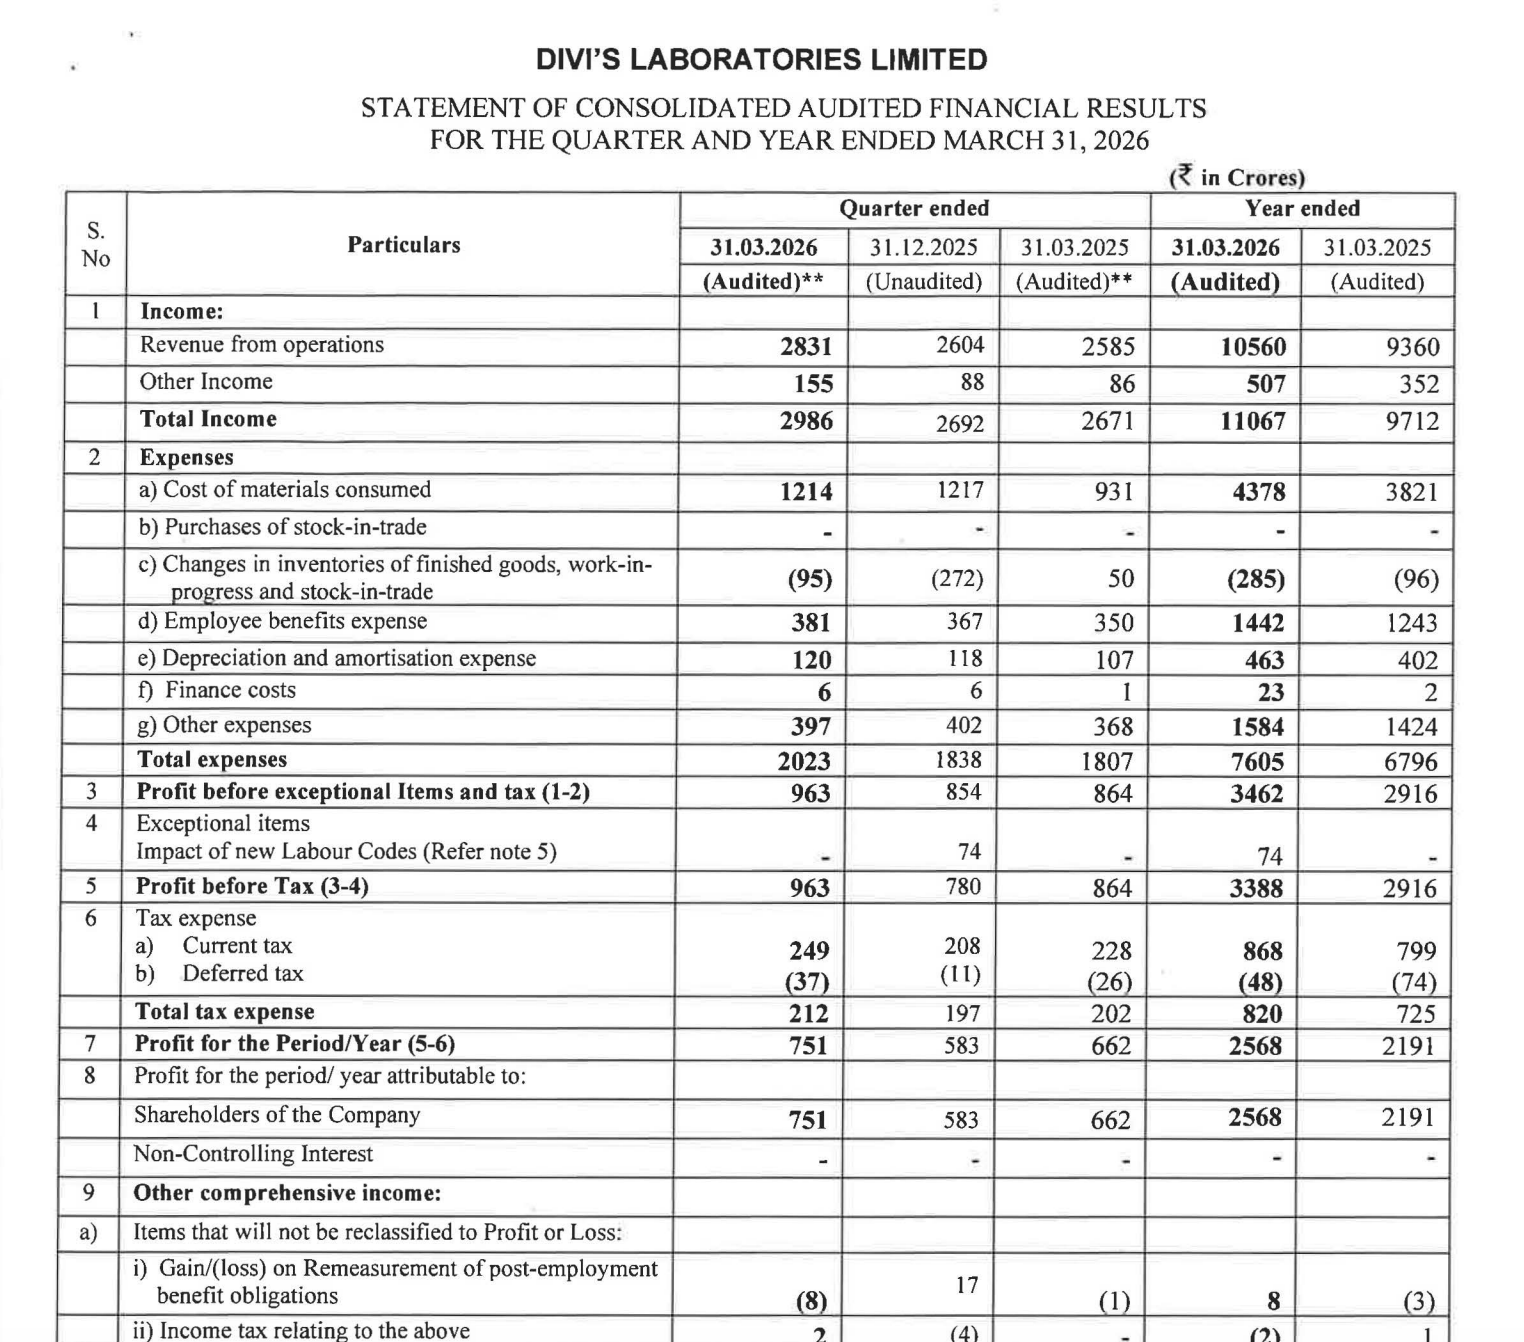
- Revenue (Q4 FY26): ₹2,831 Crore
- QoQ Change: +8.72%
- YoY Change: +9.52%
- Previous Quarter (Q3 FY26): ₹2,604 Crore
- Previous Year (Q4 FY25): ₹2,585 Crore
- Revenue (Q4 FY26): ₹2,831 Crore
- Profit After Tax (PAT):
- PAT (Q4 FY26): ₹751 Crore
- QoQ Change: +28.82%
- YoY Change: +13.44%
- Previous Quarter (Q3 FY26): ₹583 Crore
- Previous Year (Q4 FY25): ₹662 Crore
- PAT (Q4 FY26): ₹751 Crore
- QoQ Performance:
- Revenue Trend: Revenue improved steadily quarter-on-quarter with strong operational momentum.
- Profit Trend: Profit growth significantly outpaced revenue growth due to margin improvement and efficient cost control.
- Revenue Trend: Revenue improved steadily quarter-on-quarter with strong operational momentum.
Margin Analysis
Drivers:
- Better utilization of manufacturing capacities.
- Inventory movement supported profitability.
- Other expenses remained under control sequentially.
- Strong operating leverage improved margins.
- Finance cost remained negligible.
Insight:
- Divi’s continued to maintain industry-leading operating efficiency with strong earnings conversion and low leverage.
Earning quality check
Key Drivers:
- Operating cash inflow increased to ₹2,738 Cr versus ₹1,653 Cr YoY.
- Cash generated from operations rose strongly to ₹3,600 Cr.
- Low finance cost indicates strong balance sheet quality.
- Strong depreciation growth reflects capacity expansion.
- Working capital remained well managed despite inventory build-up.
Interpretations:
- Earnings quality remains very strong with healthy cash conversion, minimal leverage, and sustained operational efficiency.
balance sheet Analysis
- Total Assets FY26: ₹20,033 Cr
- Total Assets FY25: ₹16,932 Cr
- Total Liabilities FY26: ₹3,272 Cr
- Total Liabilities FY25: ₹1,963 Cr
- Total Equity FY26: ₹16,761 Cr
- Total Equity FY25: ₹14,969 Cr
Insight:
- Significant increase in capital work-in-progress indicates ongoing expansion projects.
- Equity base strengthened through retained earnings.
- Company continues to maintain a very low leverage profile.
key risks
- Export market dependency.
- Pricing pressure in generic APIs.
- Regulatory risks in pharmaceutical manufacturing.
- Inventory build-up may impact working capital efficiency.
- Currency fluctuation risks due to global exposure.
management strategy signals
Focus Area:
- Expansion of manufacturing capacities.
- Strengthening custom synthesis business.
- Focus on regulated markets.
- Product diversification.
- Long-term investment in high-value APIs.
Financial metrics table
| Particular | Q4 FY26 | Q.O.Q | Y.O.Y |
|---|---|---|---|
| Total Income | ₹2,986 Crore | +10.92% | +11.79% |
| PBT | ₹963 Crore | +23.46% | +11.46% |
| PAT | ₹751 Crore | +28.82% | +13.44% |
Indian Oil Corporation delivered a strong Q4 FY26 performance with substantial improvement in profitability, healthy operating cash flow generation, and strengthening balance sheet metrics. Petroleum products remained the key growth engine, while petrochemicals showed recovery signs. Although gas segment weakness and high capex intensity remain risks, the overall financial trajectory remains positive.
Official Exchange Filing: Divi’s Laboratories Limited
Quarterly Performance Context
FISCAL YEAR
2025-2026
AUDIT STATUS
REVIEWED


This piece of writing will help the internet visitors for setting up new webpage or
even a blog from start to end.