Quarter Ended: March 2026
Yatharth Hospital & Trauma Care Services Q4 FY26 Results: Revenue and Profit Growth Continue Amid Expansion Push
NSE
YATHARTH
BSE
543950
Yatharth Hospital & Trauma Care Services reported strong Q4 FY26 growth with double-digit revenue and profit expansion supported by higher hospital utilization and operational scale-up.
key financial highlights
- Revenue from Operations:
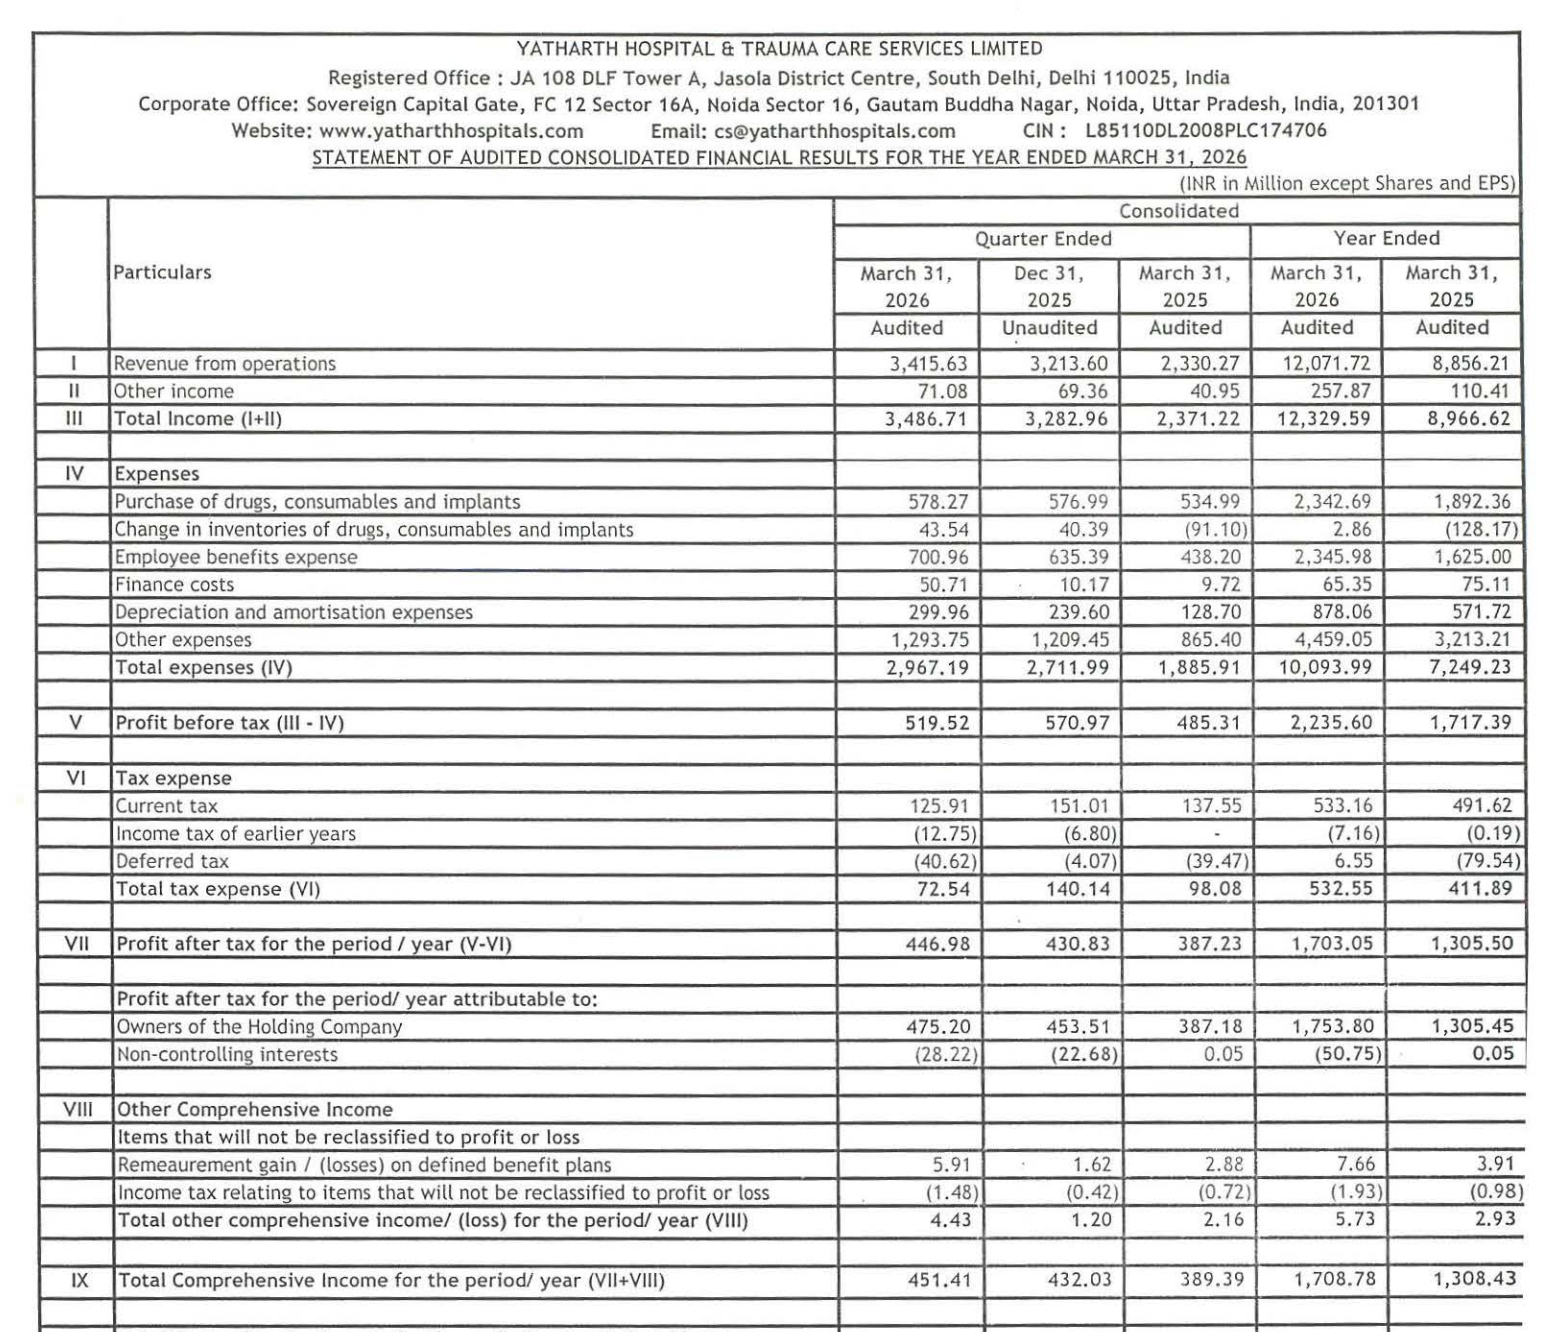
- Revenue (Q4 FY26): ₹3,415.63 Million
- QoQ Change: +6.3%
- YoY Change: +46.6%
- Previous Quarter (Q3 FY26): ₹3,213.60 Million
- Previous Year (Q4 FY25): ₹2,330.27 Million
- Revenue (Q4 FY26): ₹3,415.63 Million
- Profit After Tax (PAT):
- PAT (Q4 FY26): ₹446.8 Million
- QoQ Change: +3.7%
- YoY Change: +15.4%
- Previous Quarter (Q3 FY26): ₹430.83 Million
- Previous Year (Q4 FY25): ₹387.23 Million
- PAT (Q4 FY26): ₹446.8 Million
- QoQ Performance:
- Revenue Trend: Sequential revenue growth remained stable with continued patient inflow growth and operational ramp-up.
- Profit Trend: Profit growth improved moderately QoQ despite higher operating and employee-related expenses.
- Revenue Trend: Sequential revenue growth remained stable with continued patient inflow growth and operational ramp-up.
Margin Analysis
Drivers:
- Revenue growth outpaced consumable and fixed operational cost increases.
- Employee benefit expenses increased sharply due to hospital expansion and manpower additions.
- Depreciation expenses rose significantly reflecting commissioning of new infrastructure and assets.
- Other operating expenses expanded alongside network scale growth.
Insight:
- Operational leverage remained supportive even during an aggressive expansion and investment cycle.
Segment insight
Business Summary:
Operational performance remained strong across the healthcare delivery business, supported by higher occupancy, scale expansion, and improving hospital throughput.
Key Characteristics:
- Strong YoY growth in core hospital revenue.
- Expansion-led increase in fixed assets and goodwill.
- Stable sequential profitability despite cost escalation.
- Continued investment in healthcare infrastructure and capacity.
Earning quality check
Key Drivers:
- Operating cash inflows improved significantly during FY26.
- Core earnings growth remained operationally driven.
- Depreciation and finance costs indicate ongoing infrastructure expansion.
- High investment activity impacted free cash flow generation.
Interpretations:
- The quarter reflected healthy operating earnings quality supported by strong core business growth, although elevated capex and acquisition spending continued to pressure investing cash flows.
balance sheet Analysis
- Total Assets: ₹22,815.31 million
- Total Liabilities: ₹4,743.67 million
Insight:
- Balance sheet expansion during FY26 was driven by additions to property assets, goodwill creation, financial investments, and higher borrowings linked to ongoing expansion initiatives.
key risks
- Borrowings increased materially during FY26, increasing leverage exposure.
- Higher depreciation and employee costs may pressure margins if utilization slows.
- Aggressive expansion and acquisition spending could impact near-term cash flows.
- Healthcare regulatory and pricing risks remain relevant for hospital operators.
- Significant investing cash outflows continue to weigh on liquidity generation.
management strategy signals
Focus Area:
- Expansion of hospital infrastructure and bed capacity.
- Strengthening healthcare delivery network scale.
- Improving occupancy and operational efficiency.
- Long-term asset and healthcare ecosystem creation.
- Strategic investment-led growth execution.
Financial metrics table
| Particular | Q4 FY26 | Q.O.Q | Y.O.Y |
|---|---|---|---|
| Total Income | ₹3,486.71 Million | +6.2% | +47.0% |
| PBT | ₹519.52 Million | -9.0% | +7.0% |
| PAT | ₹446.98 Million | +3.7% | +15.4% |
Yatharth Hospital & Trauma Care Services delivered another strong quarter with robust revenue expansion and stable profitability despite rising expansion-related costs. The company remains in a heavy investment phase, but operational momentum and healthcare demand trends continue to support long-term growth visibility.
Official Exchange Filing: Yatharth Hospital & Trauma Care Services Limited
Quarterly Performance Context
FISCAL YEAR
2025-2026
AUDIT STATUS
REVIEWED