Quarter Ended: March 2026
Cyient DLM Q4 FY26 – Results Analysis
NSE
cyientdlm
BSE
543933
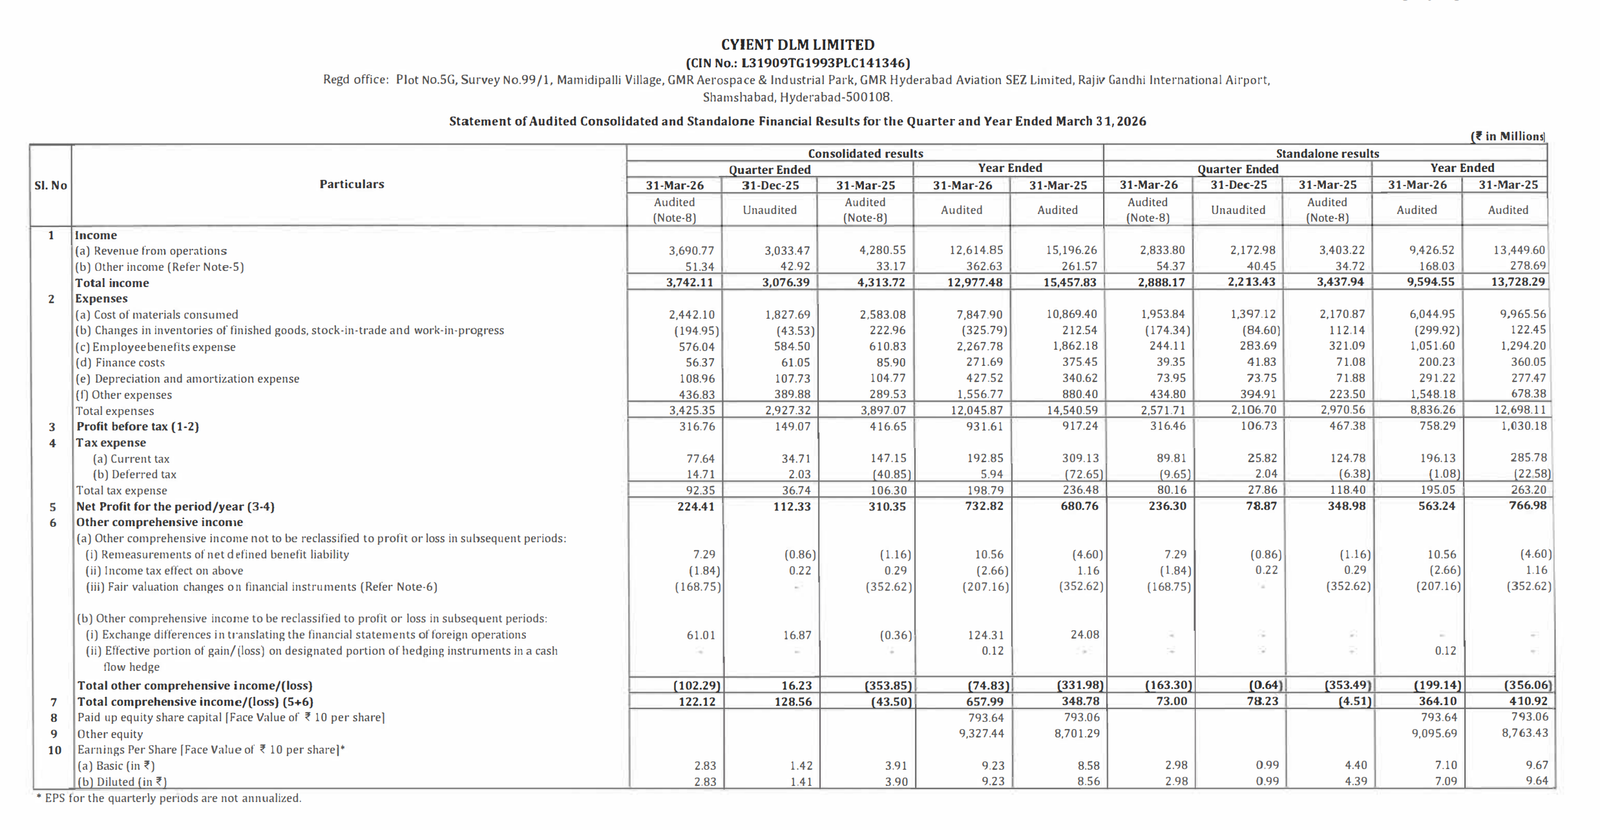
Cyient DLM reported a strong Q4 FY26 recovery, driven by sequential revenue growth, sharp profit rebound, positive operating cash generation, and improving liquidity.
However, the full-year picture was mixed, as annual consolidated revenue declined while profitability improved only modestly. Balance sheet deleveraging and cash generation were positives.
key financial highlights
- Revenue from Operations:
- Total Income (Q4 FY26): ₹3,690.77 million
- QoQ Change: +21.67%
- YoY Change: -13.78%
- Previous Quarter (Q3 FY26): ₹3,033.47 million
- Previous Year (Q4 FY25): ₹4,280.55 million
- Total Income (Q4 FY26): ₹3,690.77 million
- Profit After Tax (PAT):
- PAT (Q4 FY26): ₹224.41 million
- QoQ Growth: +99.78%
- YoY Growth: -27.69%
- Previous Quarter: ₹112.33 million
- Previous Year: ₹310.35 million
- PAT (Q4 FY26): ₹224.41 million
Margin Analysis
Positives
- Strong sequential revenue recovery
- Costs grew slower than revenue QoQ
- Operating leverage improved
- Profitability recovered sharply sequentially
Earning quality check
Moderate-to-Good Earnings Quality:
- Positive operating cash flow
- Profit recovery supported by operations
- Improved working capital performance
Caution:
- Full-year revenue contraction weakens quality signal
- Q4 still below prior-year earnings base
Interpretation:
- High-quality earnings
- Annual quality remains mixed
balance sheet Analysis
Total Assets:
- FY26: ₹16,421.86 million
- FY25: ₹16,939.13 million
- Growth: -3.05%
Equity:
- FY26: ₹10,121.08 million
- FY25: ₹9,494.35 million
- Growth: +6.60%
Current Borrowings:
- FY26: ₹283 million
- FY25: ₹957.50 million
- Major Positive
Non-Current Borrowings:
- FY26: ₹778.25 million
- FY25: ₹1,480.06 million
- Strong deleveraging
Cash & Cash Equivalent:
- FY26: ₹800.33 million
- FY25: ₹471.17 million
- Strong liquidity improvement
Balance Sheet Insight:
- Lower debt
- Higher liquidity
- Higher equity
Cash flow analysis
Operating Cash Flow
- FY26: ₹539.02 million
- FY25: Negative ₹623.94 million
- Major improvement
Investing Cash Flow
- Positive ₹1,636.10 million
- Reflects:
- Strong
Financing Cash Flow
- Negative ₹1,875.67 million
- Reflects:
- Driven by debt reduction
- Positive quality signal
Cash Position
- Cash increased:
- FY26: ₹800.33 million
- FY25: ₹471.17 million
- Very positive
key risks
- Revenue Contraction Risk – Full-year sales decline remains concern
- Demand Visibility Risk – Q4 recovery needs validation
- Working Capital Risk – Inventory and contract asset intensity remain relevant
management strategy signals
- Recovery execution
- Margin restoration
- Balance sheet strengthening
- Deleveraging
- Working capital optimization
Financial Metrics
| Particular | Q4 FY26 | Q.O.Q | Y.O.Y |
|---|---|---|---|
| Total Income | ₹3,742.11 Million | +21.73% | -11.70% |
| PBT | ₹316.76 Million | +111.54% | -23.91% |
| PAT | ₹224.41 Million | +99.78% | -27.69% |
| EPS | ₹2.83 | +99.30% | -27.62% |
Cyient DLM delivered:
- Strong sequential revenue recovery
- PAT nearly doubled QoQ
- Operating cash flow turned positive
- Strong deleveraging
- Liquidity improved
Official Exchange Filing: Cyient DLM Limited
Quarterly Performance Context
COST OF OPERATIONS AS % OF REVENUE
93%
NET PROFIT AS % OF REVENUE
6%
FISCAL YEAR
2025-2026
AUDIT STATUS
REVIEWED