Quarter Ended: March 2026
Edelweiss Financial Services Ltd – Q4 FY26 Results
NSE
edelweiss
BSE
532922
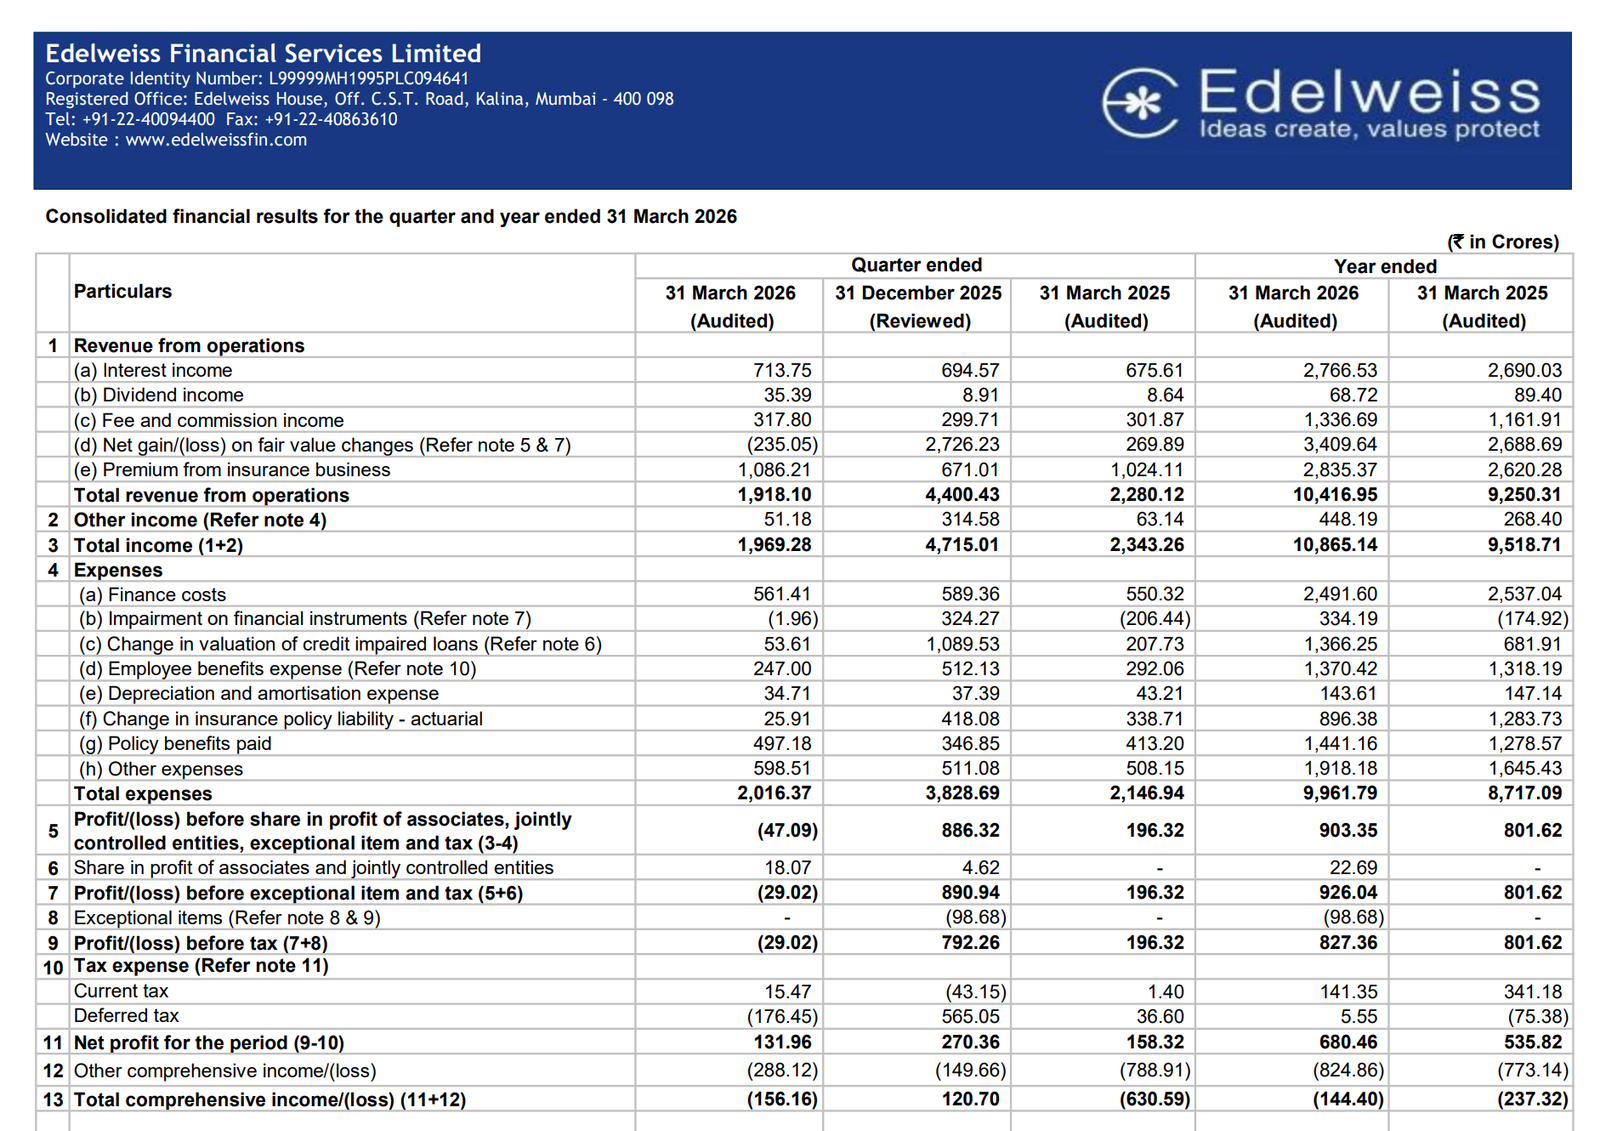
Edelweiss reported a QoQ turnaround in profitability, but YoY decline in earnings and weak operating cash flowhighlight underlying stress in lending and insurance segments.
key financial highlights
- Revenue from Operations:
- Total Income (Q4 FY26): ₹1,969 Cr
- QoQ Change: -58.2%
- YoY Change: -15.9%
- Previous Quarter (Q3 FY26): ₹4,715 Cr
- Previous Year (Q4 FY25): ₹2,343 Cr
- Total Income (Q4 FY26): ₹1,969 Cr
- Profit After Tax (PAT):
- PAT (Q4 FY26): ₹131.96 Cr
- QoQ Change: -51.2%
- YoY Change: -16.6%
- Previous Quarter (Q3 FY26): ₹270.36 Cr
- Previous Year (Q4 FY25): ₹158.32 Cr
- PAT (Q4 FY26): ₹131.96 Cr
- QoQ Performance:
- Revenue Trend: Sharp Decline
- Profit Trend: Weak
Margin Analysis
Key Observations:
- Total Expenses: ₹2,016 Cr vs ₹3,828 Cr QoQ
- Cost ratio remains high despite revenue drop
- Finance costs stable (~₹561 Cr)
Insight:
- Margins are Volatile, heavily influenced by:
- Fair value changes
- Credit impairment adjustments
- Insurance liability movements
Key Signal: Indicates non-linear earnings profile
Segment performance
Segment: Insurance Business
- Revenue: ₹919.89 Cr
- Insight: Largest contributor but declining QoQ
Segment: Capital Business
- Revenue: ₹476.94 Cr
- Insight: Significant volatility (sharp QoQ fall)
Segment: Alternative Business
- Revenue: ₹265.76 Cr
- Insight: Stable growth driver
Segment: Asset Reconstruction
- Revenue: ₹214.28 Cr
- Insight: Improving recovery-led business
Segment insight
Summary:
Highly diversified financial services model:
- Insurance → steady but margin-sensitive
- Capital markets → volatile
- ARC → cyclical recovery play
- Alternatives → emerging stable vertical
Earning quality check
Drivers:
- Fair value gains/losses (₹3,751 Cr impact)
- Credit impairment adjustments
- Insurance liability changes
Interpretation:
- Core earnings visibility is low
balance sheet Analysis
- Total Assets: ₹43,741 Cr
- Total Equity: ₹5,943 Cr
- Borrowings (Debt securities + others): ~₹17,800 Cr+
Insight:
- Leverage remains high (typical NBFC structure)
- Increase in financial liabilities
- Decline in cash position (₹2,720 Cr vs ₹4,722 Cr YoY)
Cash flow analysis
Operating Cash Flow
- FY26: ₹897 Cr
- FY25: ₹3,383 Cr
- Sharp decline (~73%)
Investing Cash Flow
- ₹(963 Cr) → continued deployment
Financing Cash Flow
- ₹(1,936 Cr) → debt repayment + dividend
Net Cash Movement
- ₹(2,002 Cr) → significant cash reduction
key risks
- Credit risk in lending business
- Earnings volatility due to fair value accounting
- Insurance liability sensitivity
- High leverage
- Weak cash flow conversion
management strategy signals
Strategic Direction:
- Focus on capital-light businesses (AMC, alternatives)
- Reduce balance sheet risk
- Strengthen insurance vertical
Financial metrics table
| Particular | Q4 FY26 | Q.O.Q | Y.O.Y |
|---|---|---|---|
| Total Income | ₹1,969 Lakh | -58.2% | -15.9% |
| PBT | – ₹29.02 Lakh | -103.7% | -114.8% |
| PAT | ₹131.96 Lakh | -51.2% | -16.6% |
Edelweiss shows headline recovery vs previous periods but underlying fundamentals remain mixed. Earnings are volatile and dependent on non-core adjustments, while cash flow weakness and leverage remain key concerns
Official Exchange Filing: Edelweiss Financial Services Ltd
FISCAL YEAR
2025-2026
AUDIT STATUS
REVIEWED