Quarter Ended: March 2026
Force Motors Limited – Q4 FY26 Results
NSE
forcemot
BSE
500033
While annual performance shows solid improvement, Q4 reflects margin pressure and declining profitability sequentially
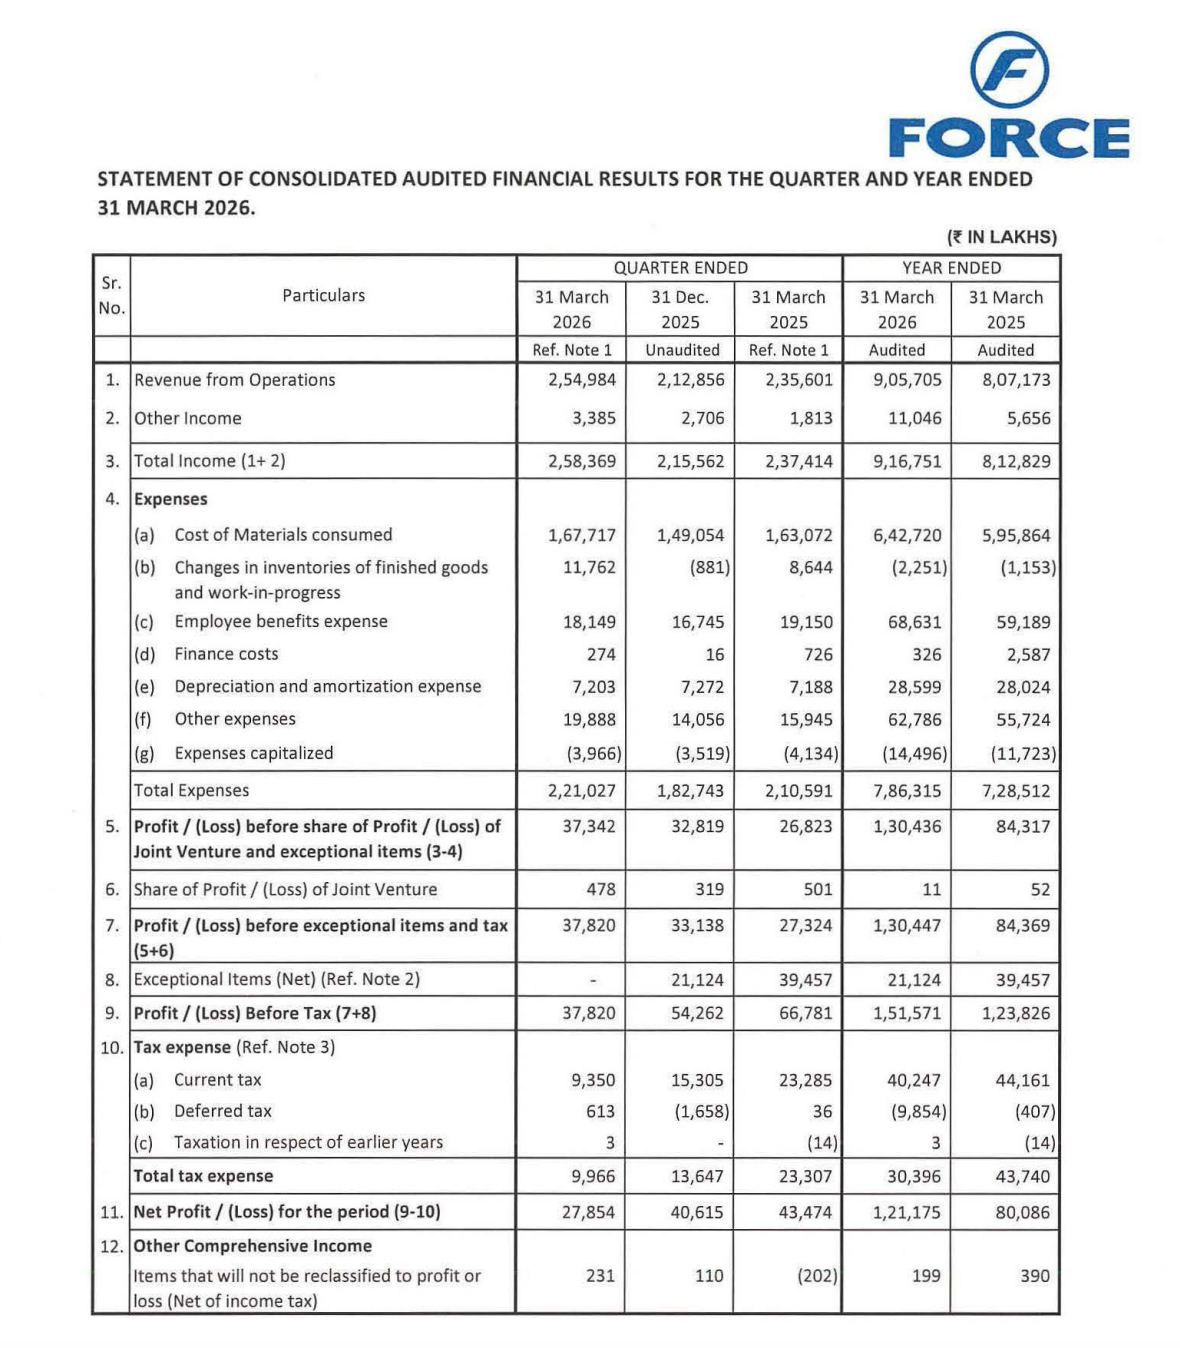
key financial highlights
- Revenue from Operations:
- Revenue (Q4 FY26): ₹2,549.84 Cr
- QoQ Change: +19.8%
- YoY Change: +8.2%
- Previous Quarter (Q3 FY26): ₹2,128.56 Cr
- Previous Year (Q4 FY25): ₹2,356.01 Cr
- Revenue (Q4 FY26): ₹2,549.84 Cr
- Profit After Tax (PAT):
- PAT (Q4 FY26): ₹278.54 Cr
- QoQ Change: -31.4%
- YoY Change: -35.9%
- Previous Quarter (Q3 FY26): ₹406.15 Cr
- Previous Year (Q4 FY25): ₹434.74 Cr
- PAT (Q4 FY26): ₹278.54 Cr
- QoQ Performance
- Revenue Trend: Strong growth
- Profit Trend: Decline
Margin Analysis
Key Drivers:
- Increase in raw material cost (₹1,67,717 lakh)
- Higher employee and operating expenses
- Negative impact from inventory changes
- Lower operating leverage in Q4
Key Signal: Margins are contracting QoQ, indicating cost pressures despite revenue growth
Segment insight
Summary:
- Business is driven by automotive manufacturing (CVs, UVs, engines), with performance linked to demand cycles and cost efficiency.
Characteristics:
- Cyclical demand-driven
- High operating leverage
- Sensitive to raw material prices
Earning quality check
Drivers:
- Core operations driven earnings
- Limited reliance on exceptional items in Q4
- Cost-driven margin compression
Interpretation:
- Earnings quality is moderate, as profitability is impacted by cost fluctuations
balance sheet Analysis
- Total Assets: ₹6,537.55 Cr
- Total Liabilities: ₹2,340.74 Cr
Insight:
- Strong equity base (~₹4,196 Cr)
- Low debt → financially stable
- Increase in working capital (inventory + receivables)
key risks
- Raw material price volatility
- Margin compression risk
- Cyclical automotive demand
- Working capital build-up
management strategy signals
Focus Area:
- Cost optimization
- Product portfolio expansion
- Export growth
- Capacity utilization improvement
Financial Metrics
| Particular | Q4 FY26 | Q.O.Q | Y.O.Y |
|---|---|---|---|
| Total Income | ₹2,583.69 Crore | +19.8% | +8.8% |
| PBT | ₹378.20 Crore | -30.3% | -43.3 |
| PAT | ₹278.54 Crore | -31.4% | -35.9% |
Force Motors delivered a strong revenue quarter but weak profitability, highlighting cost-side pressures. While the annual trend remains positive, near-term performance suggests margin stress. Sustained growth will depend on cost control and demand stability.
Official Exchange Filing: Force Motors Limited
Quarterly Performance Context
COST OF OPERATIONS AS % OF REVENUE
86%
NET PROFIT AS % OF REVENUE
11%
FISCAL YEAR
2025-2026
AUDIT STATUS
REVIEWED