Quarter Ended: March 2026
HDB Financial Services Ltd – Q4 FY26 Results Analysis
NSE
hdbfs
BSE
544429
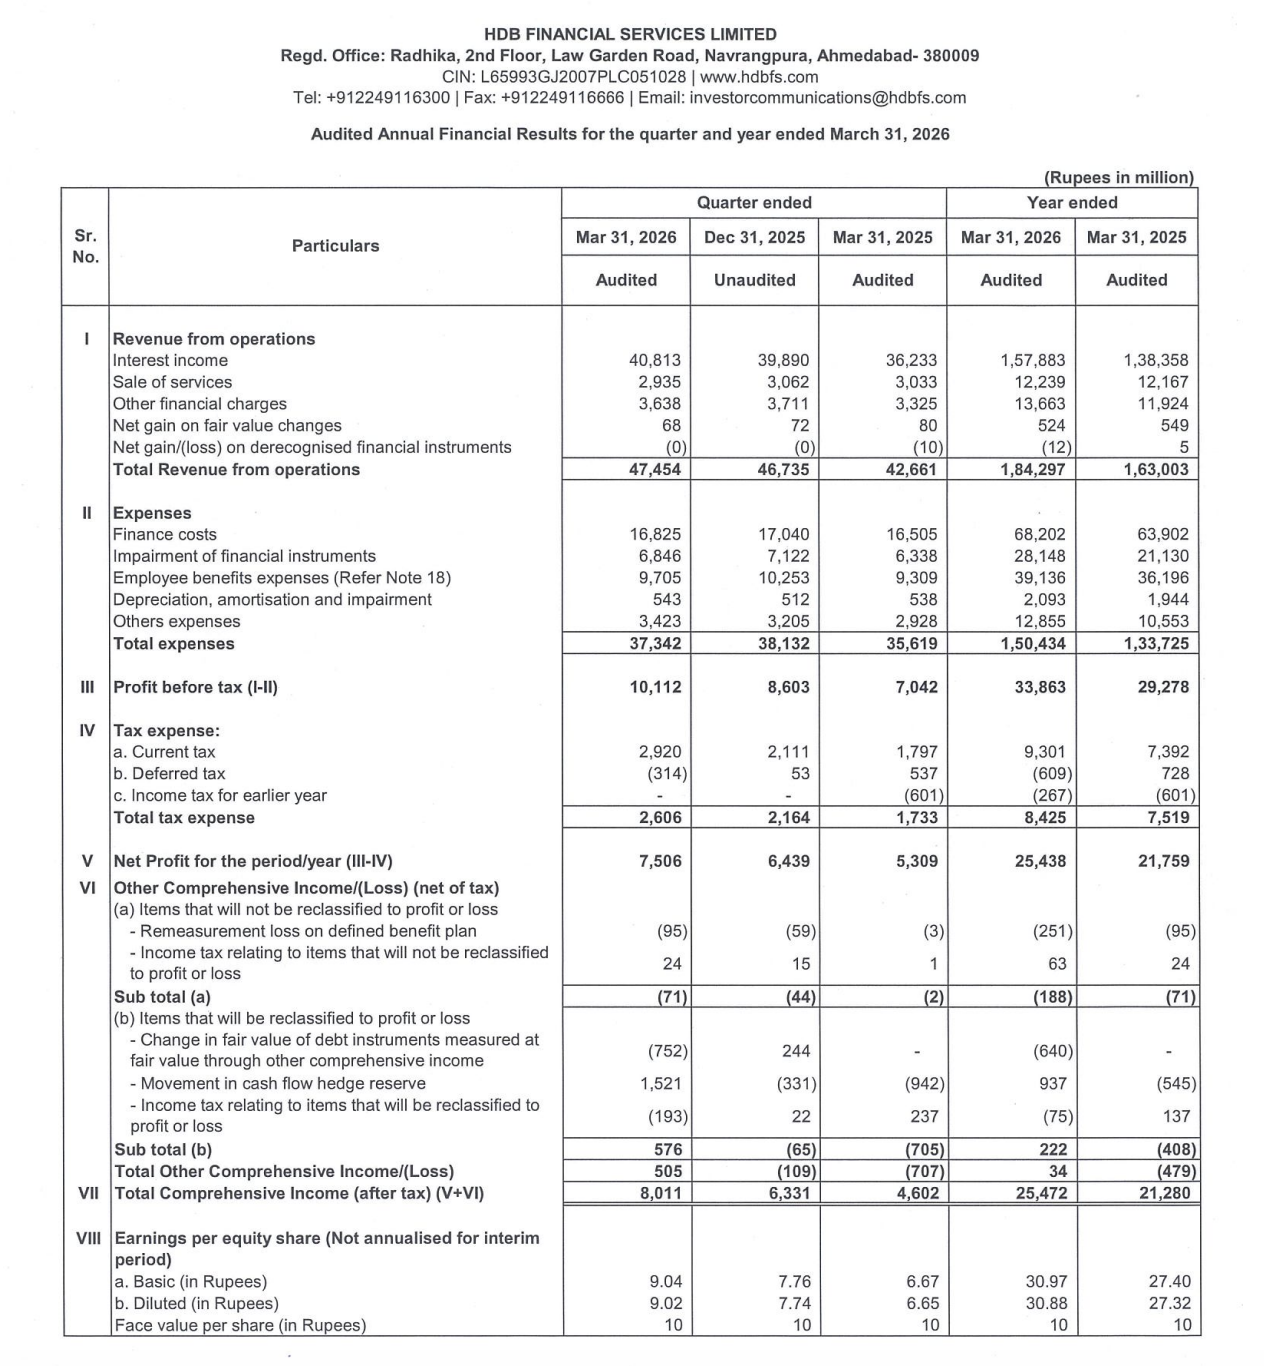
HDB delivered consistent growth across revenue and profitability, supported by stable asset quality and lending momentum.
key financial highlights
- Revenue from Operations:
- Q4 FY26 Revenue: ₹47,454 million
- QoQ Change: +1.5% (from ₹46,735 million)
- YoY Change: +11.2% (from ₹42,661 million)
- Stable growth trajectory with steady expansion in lending business
- Profit After Tax (PAT):
- Q4 FY26 PAT: ₹7,506 million
- QoQ Change: +16.6% (from ₹6,439 million)
- YoY Change: +41.4% (from ₹5,309 million)
- Strong profitability growth driven by operating leverage and controlled costs
- QoQ Trend Insight:
- Revenue Trend: Stable Growth
- Profit Trend: Strong Growth
Margin Analysis
- Controlled expense growth vs revenue
- Stable credit cost despite loan book expansion
- Improvement in operating leverage
Key Signal: Margins are expanding, indicating strong operational efficiency
Segment performance
- Lending Business
- Revenue: ₹44,519 million
- Insights:
- Core growth driver
- Strong profit contribution
- Stable expansion YoY
- BPO Services
- Revenue: ₹2,935 million
- Insights:
- Flat performance
- Minor contribution to overall profitability
Segment Insight:
- Lending segment dominates (>90% revenue)
- Business model heavily dependent on credit growth
- BPO acts as supporting vertical
Earning quality check
Drivers:
- Core operating income-driven growth
- No major exceptional distortions
- Stable credit cost structure
Interpretation: Earnings quality is high and sustainable
balance sheet analysis
- Total Assets: ₹12,36,515 million
- Total Liabilities: ₹10,29,875 million
Indicates: Strong loan book growth with controlled leverage; NBFC structure remains capital intensive but stable
key risks
- Credit risk due to lending exposure
- Rising interest rate environment
- Asset quality deterioration risk
- Regulatory tightening in NBFC sector
management strategy
- Expansion in retail and commercial lending
- Maintaining asset quality
- Digital and operational efficiency improvements
Financial Metrics
| Particular | In ₹ Million | Q.O.Q (%) | Y.O.Y(%) |
|---|---|---|---|
| Total Income | 47,454 | 1.5 | 11.2 |
| PBT | 10,112 | 17.5 | 43.6 |
| PAT | 7,506 | 16.6 | 41.4 |
| EPS | 9.04 | 16.5 | 35.5 |
HDB Financial Services delivered a strong and consistent quarter, with healthy growth in both revenue and profitability. Stable margins and high earnings quality make it a fundamentally strong NBFC with sustained growth visibility.
Quarterly Performance Context
REVENUE ACHIEVMENT
100%
COST OF OPERATIONS
79%
NET PROFIT
15.8%
FISCAL YEAR
2025-2026
AUDIT STATUS
REVIEWED