Quarter Ended: March 2026
Indian Oil Corporation Limited – Q4 FY26 Results
NSE
ioc
BSE
530965
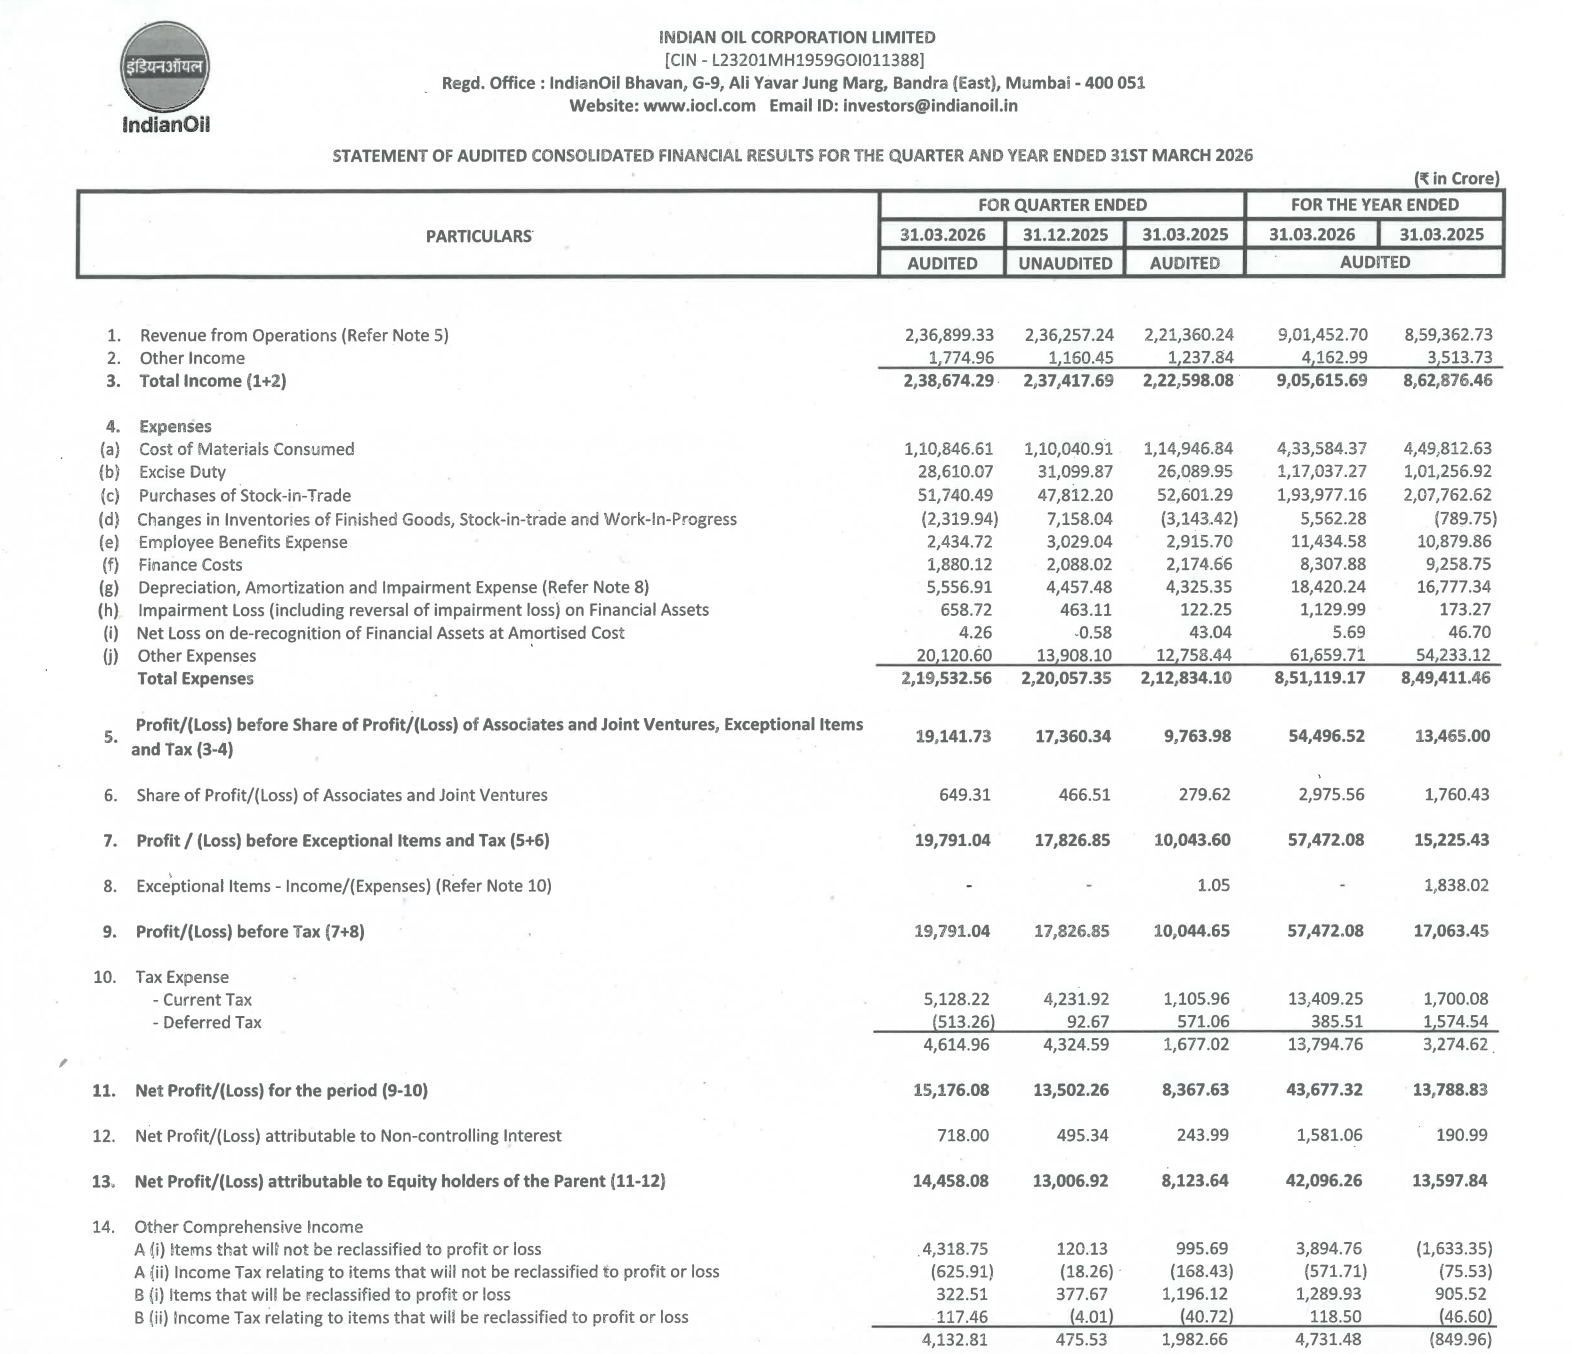
Indian Oil Corporation reported a strong Q4 FY26 performance with sharp YoY growth in revenue and profitability, supported by improved refining margins, petrochemical recovery, and strong petroleum product profitability.
key financial highlights
- Revenue from Operations:
- Revenue (Q4 FY26): ₹2,36,899.33 Crore
- QoQ Change: +0.27%
- YoY Change: +7.02%
- Previous Quarter (Q3 FY26): ₹2,36,257.24 Crore
- Previous Year (Q4 FY25): ₹2,21,360.24 Crore
- Revenue (Q4 FY26): ₹2,36,899.33 Crore
- Profit After Tax (PAT):
- PAT (Q4 FY26): ₹14,458.08 Crore
- QoQ Change: +11.16%
- YoY Change: +78.00%
- Previous Quarter (Q3 FY26): ₹13,006.92 Crore
- Previous Year (Q4 FY25): ₹8,123.64 Crore
- PAT (Q4 FY26): ₹14,458.08 Crore
- QoQ Performance:
- Revenue Trend: Revenue remained stable quarter-on-quarter with modest growth.
- Profit Trend: Profitability improved significantly sequentially due to operational efficiency and better segment earnings.
- Revenue Trend: Revenue remained stable quarter-on-quarter with modest growth.
Margin Analysis
Drivers:
- Petroleum products segment profit more than doubled YoY.
- Inventory movement improved versus prior-year quarter.
- Lower impairment and stable employee costs supported margins.
- Finance costs remained elevated at ₹1,880.12 Cr.
- Depreciation and amortization expenses increased materially.
Insight:
- Core operational profitability strengthened substantially despite cost inflation and high capital expenditure intensity.
Segment performance
Segments: Petroleum Products
- Revenue: ₹2,20,218.01 Crore
- Insights:
- Primary earnings driver with major profitability expansion
- Segment profit surged to ₹21,664.95 Cr from ₹10,238.90 Cr YoY.
- Refining and marketing businesses remained the largest contributor.
Segments: Petrochemicals
- Revenue: ₹8,010.80 Crore
- Insights:
- Recovery visible from prior weak quarter
- Returned to profitability after losses in previous comparable periods.
- Indicates recovery in petrochemical spreads.
Segments: Gas
- Revenue: ₹11,377.27 Crore
- Insights:
- Segment profitability weakened sharply
- Reported segment loss of ₹1,145.26 Cr.
- Weak gas economics and pricing pressure impacted profitability.
Segments: Other Business Activities
- Revenue: ₹1,669.86 Crore
- Insights:
- Includes exploration, explosives, renewable energy.
- Stable contribution from diversification initiatives.
Segment insight
Business Summary:
IOCL’s earnings profile remains heavily dependent on petroleum products, while petrochemicals are gradually recovering and gas operations remain under pressure.
Key Characteristics:
- Petroleum products contribute dominant revenue and profits.
- Gas business remains volatile.
- Petrochemicals provide diversification support.
- Renewable and exploration businesses remain relatively small.
Earning quality check
Key Drivers:
- Operating cash flow increased sharply to ₹76,142.08 Cr.
- PAT growth significantly exceeded revenue growth.
- Strong working capital improvement from trade payables.
- Higher depreciation indicates ongoing asset expansion.
- Strong contribution from associates and joint ventures.
Interpretations:
- Earnings quality appears healthy due to strong operating cash generation and broad-based operational improvement rather than purely one-off items.
balance sheet Analysis
- Total Assets: ₹5,28,954.96 Cr
- Total Liabilities: ₹3,03,407.85 Cr
- Total Equity: ₹2,25,547.11 Cr
Insight:
- Asset base expanded due to ongoing capital expenditure and project investments.
- Total liabilities reduced YoY, improving leverage profile.
- Equity strengthened significantly through retained earnings.
key risks
- Gas business losses may continue if pricing remains weak.
- High finance costs continue to pressure profitability.
- Large capex commitments increase execution risk.
- Exposure to crude oil price volatility.
- Regulatory intervention risk in fuel pricing.
management strategy signals
Focus Area:
- Expansion of refining and petrochemical capacity.
- Investment in energy transition and renewables.
- Strengthening operational efficiency.
- Continued infrastructure and pipeline expansion.
- Diversification into gas and alternative energy.
Financial metrics table
| Particular | Q4 FY26 | Q.O.Q | Y.O.Y |
|---|---|---|---|
| Total Income | ₹2,38,674.29 Crore | +0.53% | +7.22% |
| PBT | ₹19,791.04 Crore | +11.01% | +97.02% |
| PAT | ₹15,176.08 Crore | +12.39% | +81.28% |
Indian Oil Corporation delivered a strong Q4 FY26 performance with substantial improvement in profitability, healthy operating cash flow generation, and strengthening balance sheet metrics. Petroleum products remained the key growth engine, while petrochemicals showed recovery signs. Although gas segment weakness and high capex intensity remain risks, the overall financial trajectory remains positive.
Official Exchange Filing: Indian Oil Corporation Limited
Quarterly Performance Context
FISCAL YEAR
2025-2026
AUDIT STATUS
REVIEWED