Quarter Ended: March 2026
Mahindra & Mahindra Ltd – Q4 FY26 Results
NSE
M&M
BSE
500520
Mahindra & Mahindra delivered robust YoY growth with strong operating cash flows and segmental strength across automotive and farm equipment, reflecting cyclical uptrend and operational efficiency.
key financial highlights
- Revenue from Operations:
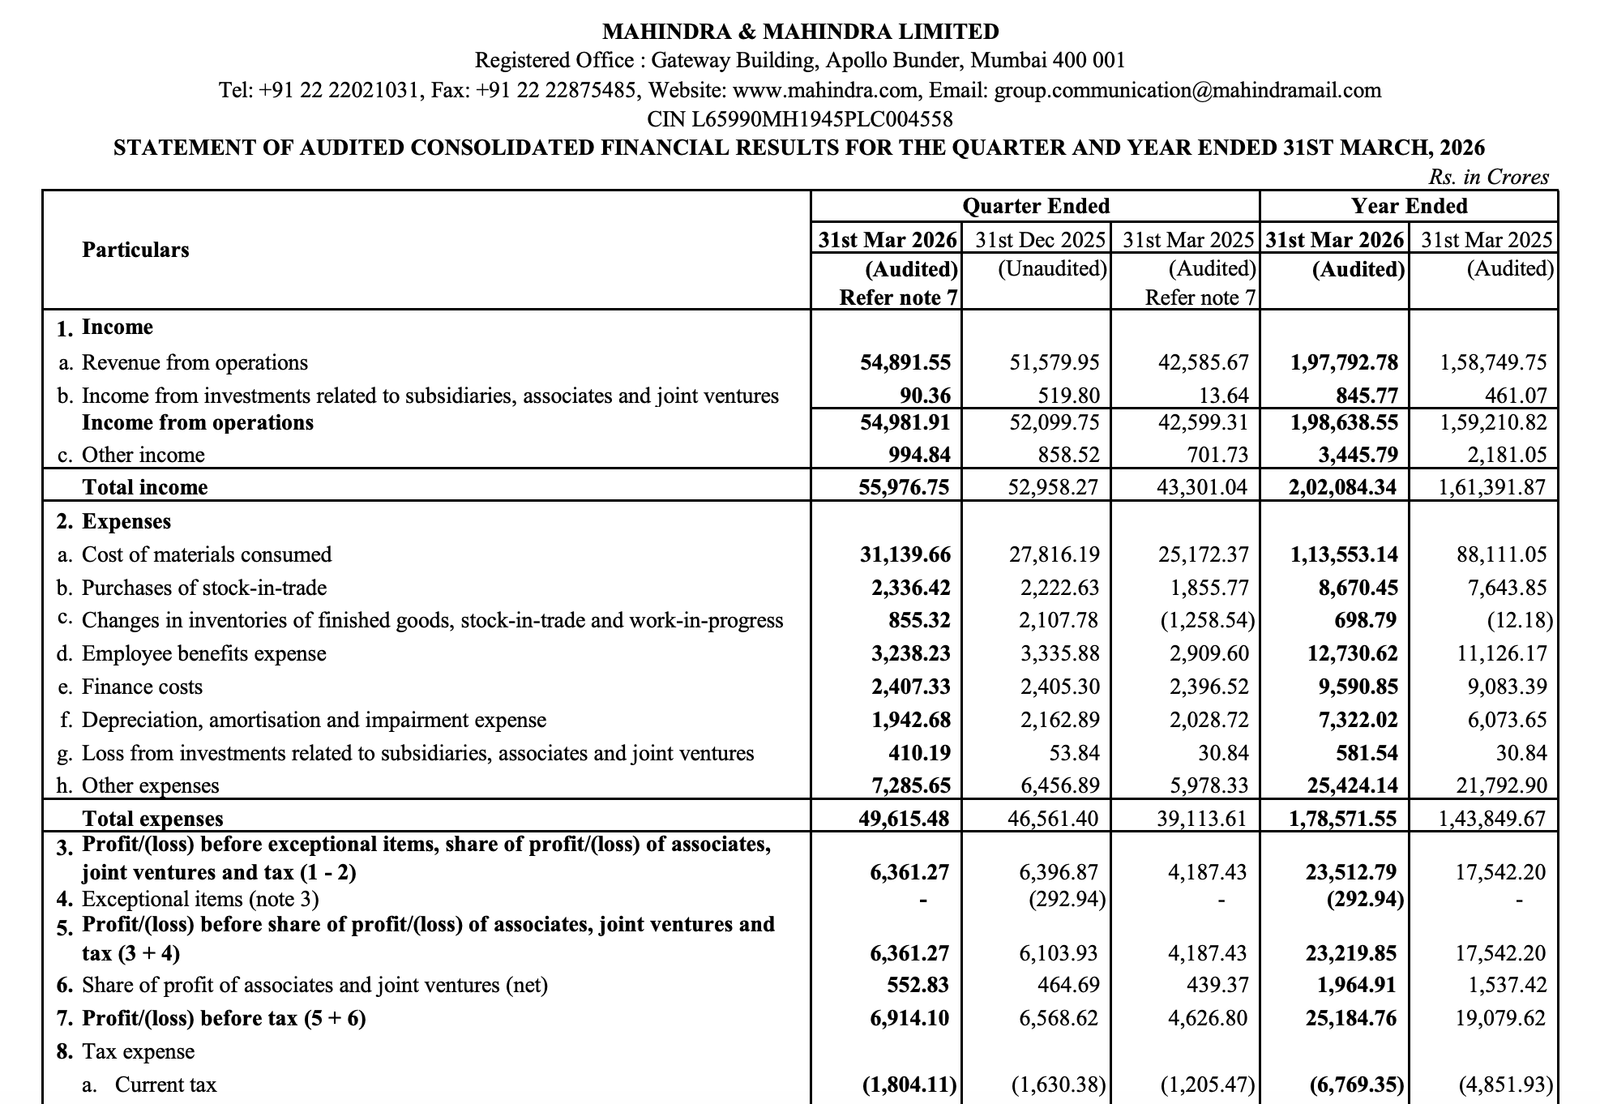
- Total Income (Q4 FY26): ₹55,976.75 Crore
- QoQ Change: +5.70%
- YoY Change: +29.30%
- Previous Quarter (Q3 FY26): ₹52,958.27 Crore
- Previous Year (Q4 FY25): ₹43,301.04 Crore
- Total Income (Q4 FY26): ₹55,976.75 Crore
- Profit After Tax (PAT):
- PAT (Q4 FY26): ₹5,259.91 Crore
- QoQ Change: +4.75%
- YoY Change: +48.52%
- Previous Quarter (Q3 FY26): ₹5,021.47 Crore
- Previous Year (Q4 FY25): ₹3,541.85 Crore
- PAT (Q4 FY26): ₹5,259.91 Crore
- QoQ Performance
- Revenue Trend: Moderate Growth
- Profit Trend: Stable Growth
Margin Analysis
Drivers:
- Strong operating leverage from auto segment
- Stable raw material cost environment
- Controlled employee and overhead expenses
- Improved contribution from high-margin segments
Insight:
- Margin expansion supported by scale and segment mix
Segment performance
Segments: Automotive
- Revenue: ₹34,294.18 Crores
- Insights:
- Strong YoY demand recovery
- SUV segment driving growth
- Improved profitability
Segments: Farm Equipment
- Revenue: ₹10,022.10 Crores
- Insights:
- Stable rural demand
- Seasonal normalization
- Margin steady
Segments: Financial Services
- Revenue: ₹5,525.29 Crores
- Insights:
- Loan book expansion
- Strong interest income growth
Segments: Industrial & Consumer Services
- Revenue: ₹6,622.18 Crores
- Insights:
- Gradual recovery
- Diversified revenue support
Segment insight
Summary:
- Mahindra & Mahindra operates a diversified business model with strong cyclicality tied to auto and agriculture sectors
Charcateristics:
- Auto-led growth engine
- Rural economy dependency (farm segment)
- Financial services providing leverage
- Diversified industrial base
Earning quality check
Drivers:
- Core operating profit driven growth
- Contribution from associates and JVs
- Minimal exceptional distortions
Interpretations:
- Earnings are high quality and operationally driven, supported by core business strength
balance sheet Analysis
- Total Assets: ₹3,17,634.64 Crore
- Total Liabilities: ₹2,08,143.64 Crore
Insight:
- Strong asset base expansion
- Increased borrowings aligned with growth
- Equity strengthened to ₹1,09,491 crore
key risks
- Auto demand cyclicality
- Rural demand dependency
- Commodity price volatility
- Execution risk in EV transition
- Global macro slowdown impact
management strategy signals
Focus Area:
- Strengthen SUV leadership
- Expand EV portfolio
- Grow farm mechanization business
- Scale financial services
Financial metrics table
| Particular | Q4 FY26 | Q.O.Q | Y.O.Y |
|---|---|---|---|
| Total Income | ₹55,976.75 Crore | +5.70% | +29.30% |
| PBT | ₹6,914.10 Crore | +5.40% | +49.45% |
| PAT | ₹5,259.91 Crore | +4.75% | +48.52% |
Mahindra & Mahindra is demonstrating strong cyclical recovery with structural growth drivers, backed by auto dominance, rural demand stability, and EV transition. The company remains a core long-term compounder with sector leadership advantage.
Official Exchange Filing: Mahindra & Mahindra Limited
Quarterly Performance Context
COST OF OPERATIONS AS % OF REVENUE
89%
NET PROFIT AS % OF REVENUE
9.4%
FISCAL YEAR
2025-2026
AUDIT STATUS
REVIEWED