Quarter Ended: March 2026
Nelco Q4 FY26 – Results Analysis
NSE
nelco
BSE
504112
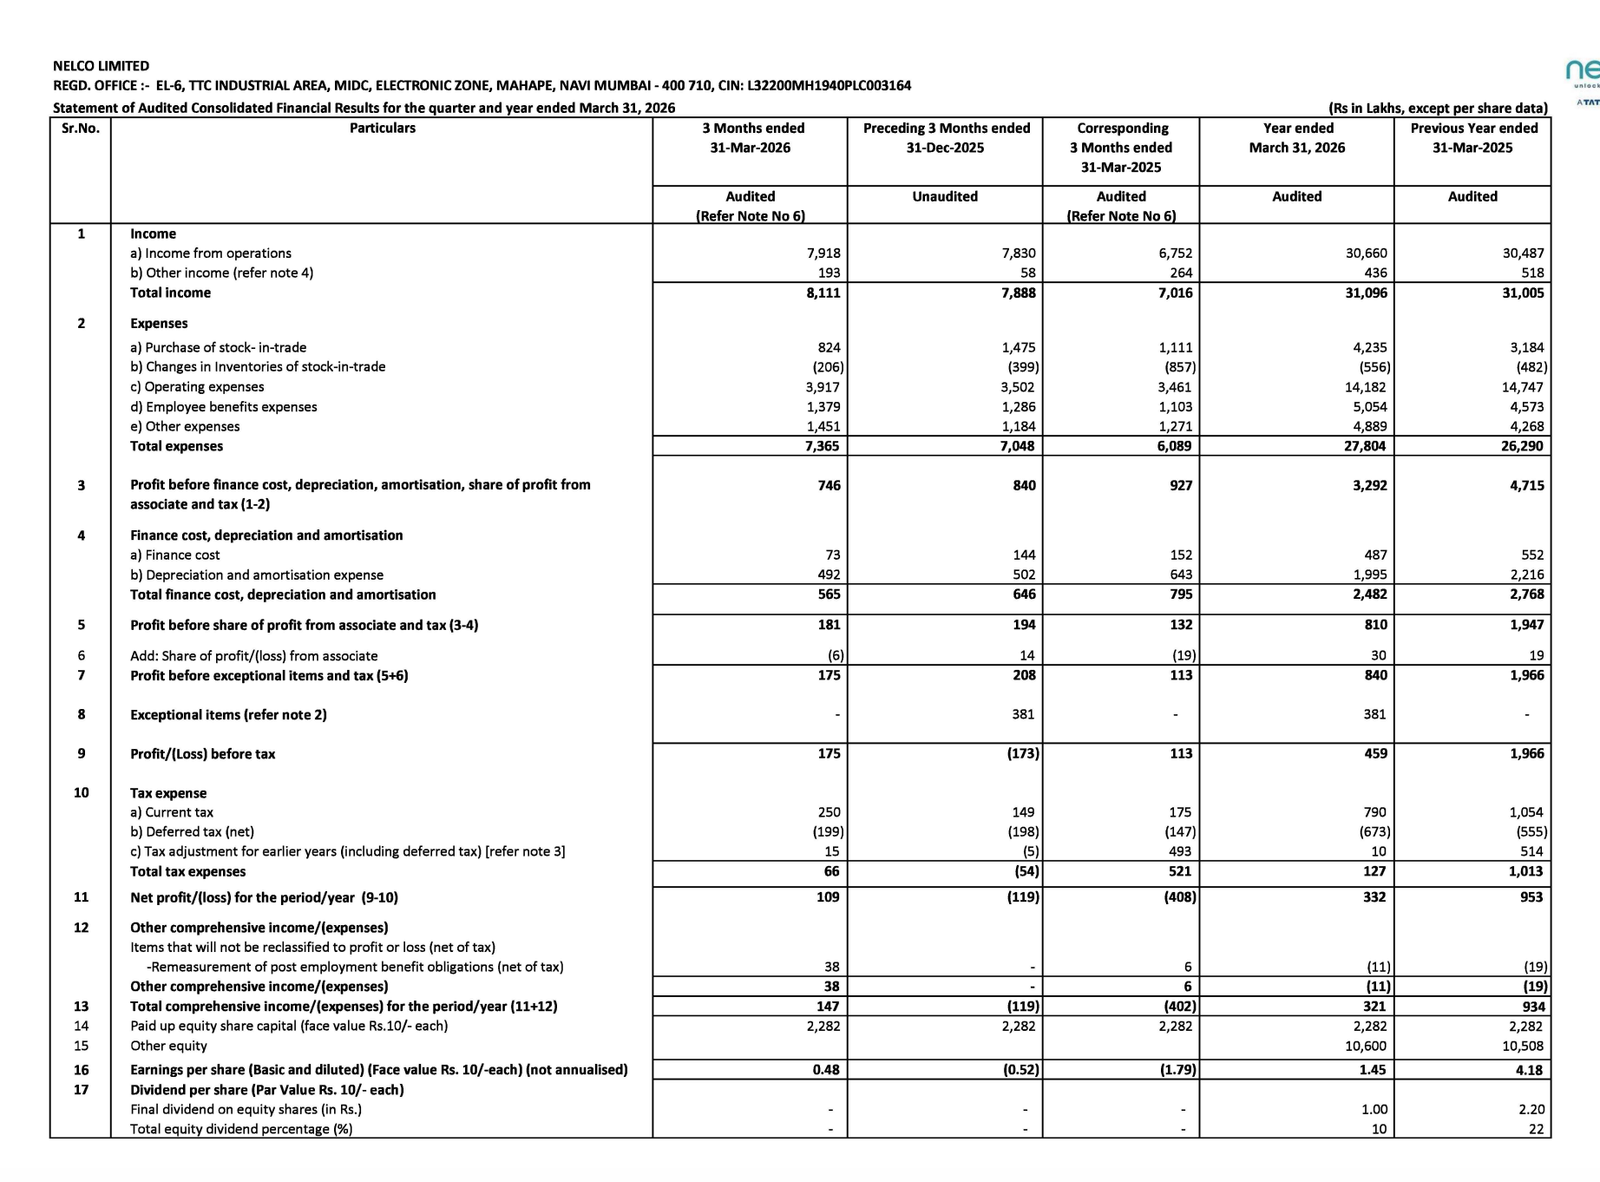
Nelco reported a mixed Q4 FY26 performance.
The quarter showed a return to profitability sequentially, with net profit turning positive versus a loss in the previous quarter. Revenue improved both QoQ and YoY, while operating cash flow remained positive.
key financial highlights
- Revenue from Operations:
- Total Income (Q4 FY26): ₹7,918 lakh
- QoQ Change: +1.12%
- YoY Change: +17.27%
- Previous Quarter (Q3 FY26): ₹7,830 lakh
- Previous Year (Q4 FY25): ₹6,752 lakh
- Total Income (Q4 FY26): ₹7,918 lakh
- Moderate but healthy growth
- Profit After Tax (PAT):
- PAT (Q4 FY26): ₹109 lakh
- QoQ Growth: Turnaround to profit
- YoY Growth: Strong improvement
- Previous Quarter: Loss of ₹119 lakh
- Previous Year: Loss of ₹408 lakh
- PAT (Q4 FY26): ₹109 lakh
Margin Analysis
Positives
- Return to profitability
- Revenue growth
- Lower finance costs YoY
- Improved Q4 earnings conversion
Negatives
- Expenses grew faster than revenue
- Full-year margins compressed
- Operating profitability below prior year
Key Signal: Full-year margins remain under pressure
Earning quality check
Positive:
- Q4 recovery appears operationally driven
Negative:
- FY26 earning weakened materially
- PAT down 65%
- Profit before tax down sharply
- Operating leverage remains under pressure
Interpretation:
- Quarterly earnings improving.
- Annual earnings quality remains mixed
balance sheet Analysis
Total Assets:
- FY26: ₹34,737 lakh
- FY25: ₹28,745 lakh
- Growth: +20.84%
Total Liabilities:
- FY26: ₹21,854 lakh
- FY25: ₹15,955 lakh
- Growth: +36.97%
Borrowings:
- FY26: ₹5,877 lakh
- FY25: ₹3,795 lakh
- Growth: +54.86%
Balance Sheet Insight:
- Assets grew, but growth has been liability-funded
- Mixed signal
Cash flow analysis
Operating Cash Flow
- FY26: ₹1,526 lakh
- FY25: ₹1,966 lakh
- Decline: -22.38%
Investing Cash Flow
- Negative ₹2,076 lakh outflow
- Reflects:
- Capex-led outflow
Financing Cash Flow
- Positive ₹1,104 lakh
- Reflects:
- External funding support
Cash Position
- Cash increased:
- FY26: ₹1,939 lakh
- FY25: ₹1,385 lakh
Indicates: Positive liquidity improvement
key risks
- Full-year earnings remain under pressure
- Debt-funded growth raises monitoring risk
- Operating expenses rising faster than revenue
- Net profit conversion remains thin
management strategy signals
- Revenue stabilization
- Cost optimization
- Balance sheet-supported growth
- Capex deployment
- Working capital management
Financial Metrics
| Particular | Q4 FY26 | Q.O.Q | Y.O.Y |
|---|---|---|---|
| Total Income | ₹8,111 Lakh | +2.83% | +15.60% |
| PBT | ₹175 Lakh | Turnaround | +54.87% |
| PAT | ₹109 Lakh | Turnaround | Positive vs Loss |
| EPS | ₹0.48 | Positive | Positive vs Loss |
NELCO delivered:
- Return to quarterly profitability
- Revenue growth
- Positive operating cash flow
- Improved liquidity
- Stronger asset base
Official Exchange Filing: NELCO Limited
Quarterly Performance Context
COST OF OPERATIONS AS % OF REVENUE
93%
NET PROFIT AS % OF REVENUE
1.38%
FISCAL YEAR
2025-2026
AUDIT STATUS
REVIEWED