Quarter Ended: March 2026
PCBL Chemical Ltd – Q4 FY26 Results
NSE
pcbl
BSE
506590
While QoQ recovery is visible, profitability remains significantly below last year due to margin compression and weak chemical segment contribution
key financial highlights
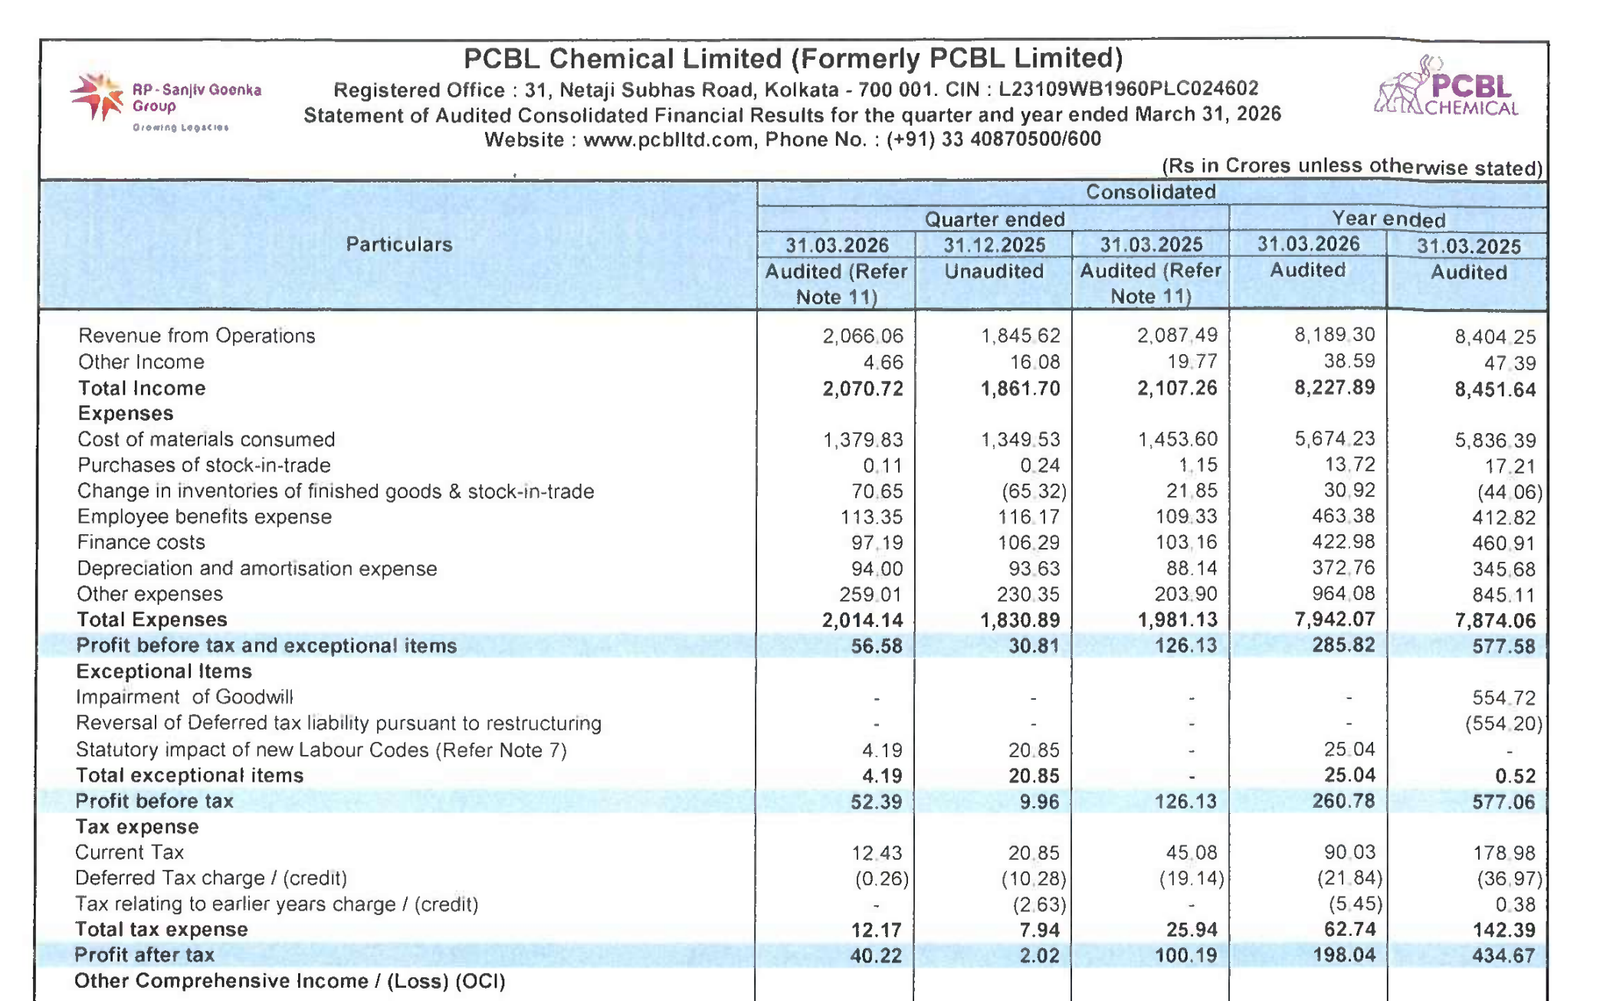
- Revenue from Operations:
- Revenue (Q4 FY26): ₹2,066.06 Cr
- QoQ Change: +11.0%
- YoY Change: -1.0%
- Previous Quarter (Q3 FY26): ₹1,845.62 Cr
- Previous Year (Q4 FY25): ₹2,087.49 Cr
- Revenue (Q4 FY26): ₹2,066.06 Cr
- Profit After Tax (PAT):
- PAT (Q4 FY26): ₹40.22 Cr
- QoQ Change: +1891%
- YoY Change: -59.9%
- Previous Quarter (Q3 FY26): ₹2.02 Cr
- Previous Year (Q4 FY25): ₹100.19 Cr
- PAT (Q4 FY26): ₹40.22 Cr
- QoQ Performance
- Revenue Trend: Strong recovery
- Profit Trend: Sharp rebound (low base driven)
Margin Analysis
Drivers:
- Significant decline in operating margins YoY
- High finance costs relative to operating profit
- Weak realization in carbon black segment
Insight:
- Margin compression remains the biggest concern despite QoQ improvement
Segment performance
Segment: Carbon Black
- Revenue: ₹1,680.58 Cr
- Core revenue contributor (~81%)
- Margins under pressure YoY
Segment: Power
- Revenue: ₹81.54 Cr
- Stable and predictable contribution
Segment: Chemical
- Revenue: ₹338.54 Cr
- Weak profitability despite stable revenue
Segment insight
Summary:
- Business is heavily dependent on carbon black, with chemical diversification still not contributing meaningfully to profits
Charcateristics:
- Cyclical commodity-linked business
- High dependence on spreads (raw material vs selling price)
- Early-stage specialty chemical expansion
Earning quality check
Drivers:
- Low PAT due to weak operating margins
- No major exceptional support in Q4
- Earnings recovery largely base-effect driven
Interpretations:
- Earnings quality is moderate; recovery is not yet structurally strong
balance sheet Analysis
- Total Assets: ₹11,294.54 Cr
- Total Liabilities: ₹7,275.39 Cr
Insight:
- Stable balance sheet with moderate leverage; no aggressive debt buildup
Cash flow analysis
Operating Cash Flow: ₹1,576.04 Cr (Strong improvement)
Investing Cash Flow: ₹(675.18 Cr)
Financing Cash Flow: ₹(989.87 Cr)
Insight:
- Strong operating cash generation but heavy financing outflows indicate debt servicing pressure
key risks
- Commodity price volatility (carbon black spreads)
- Weak margin sustainability
- Dependence on tyre industry demand
- Underperformance of chemical segment
management strategy signals
Focus Area:
- Expansion in specialty chemicals
- Margin improvement initiatives
- Cost optimization
Financial metrics table
| Particular | Q4 FY26 | Q.O.Q | Y.O.Y |
|---|---|---|---|
| Revenue | ₹2,066.06 Cr | +11.9% | -1.0% |
| EBITDA | ₹227.82 Cr | +20.6% | -17.8% |
| PAT | ₹40.22 Cr | +1891% | -59.9% |
PCBL is showing early signs of recovery on a sequential basis, but structurally the business is still facing margin pressure. The real trigger for re-rating will be sustained margin improvement and successful scale-up of the chemical segment
Official Exchange Filing: PCBL Chemical Ltd
Quarterly Performance Context
COST OF OPERATIONS AS % OF REVENUE
97%
NET PROFIT AS % OF REVENUE
1.94%
FISCAL YEAR
2025-2026
AUDIT STATUS
REVIEWED