Quarter Ended: March 2026
Skipper Limited – Q4 FY26 Results
NSE
skipper
BSE
538562
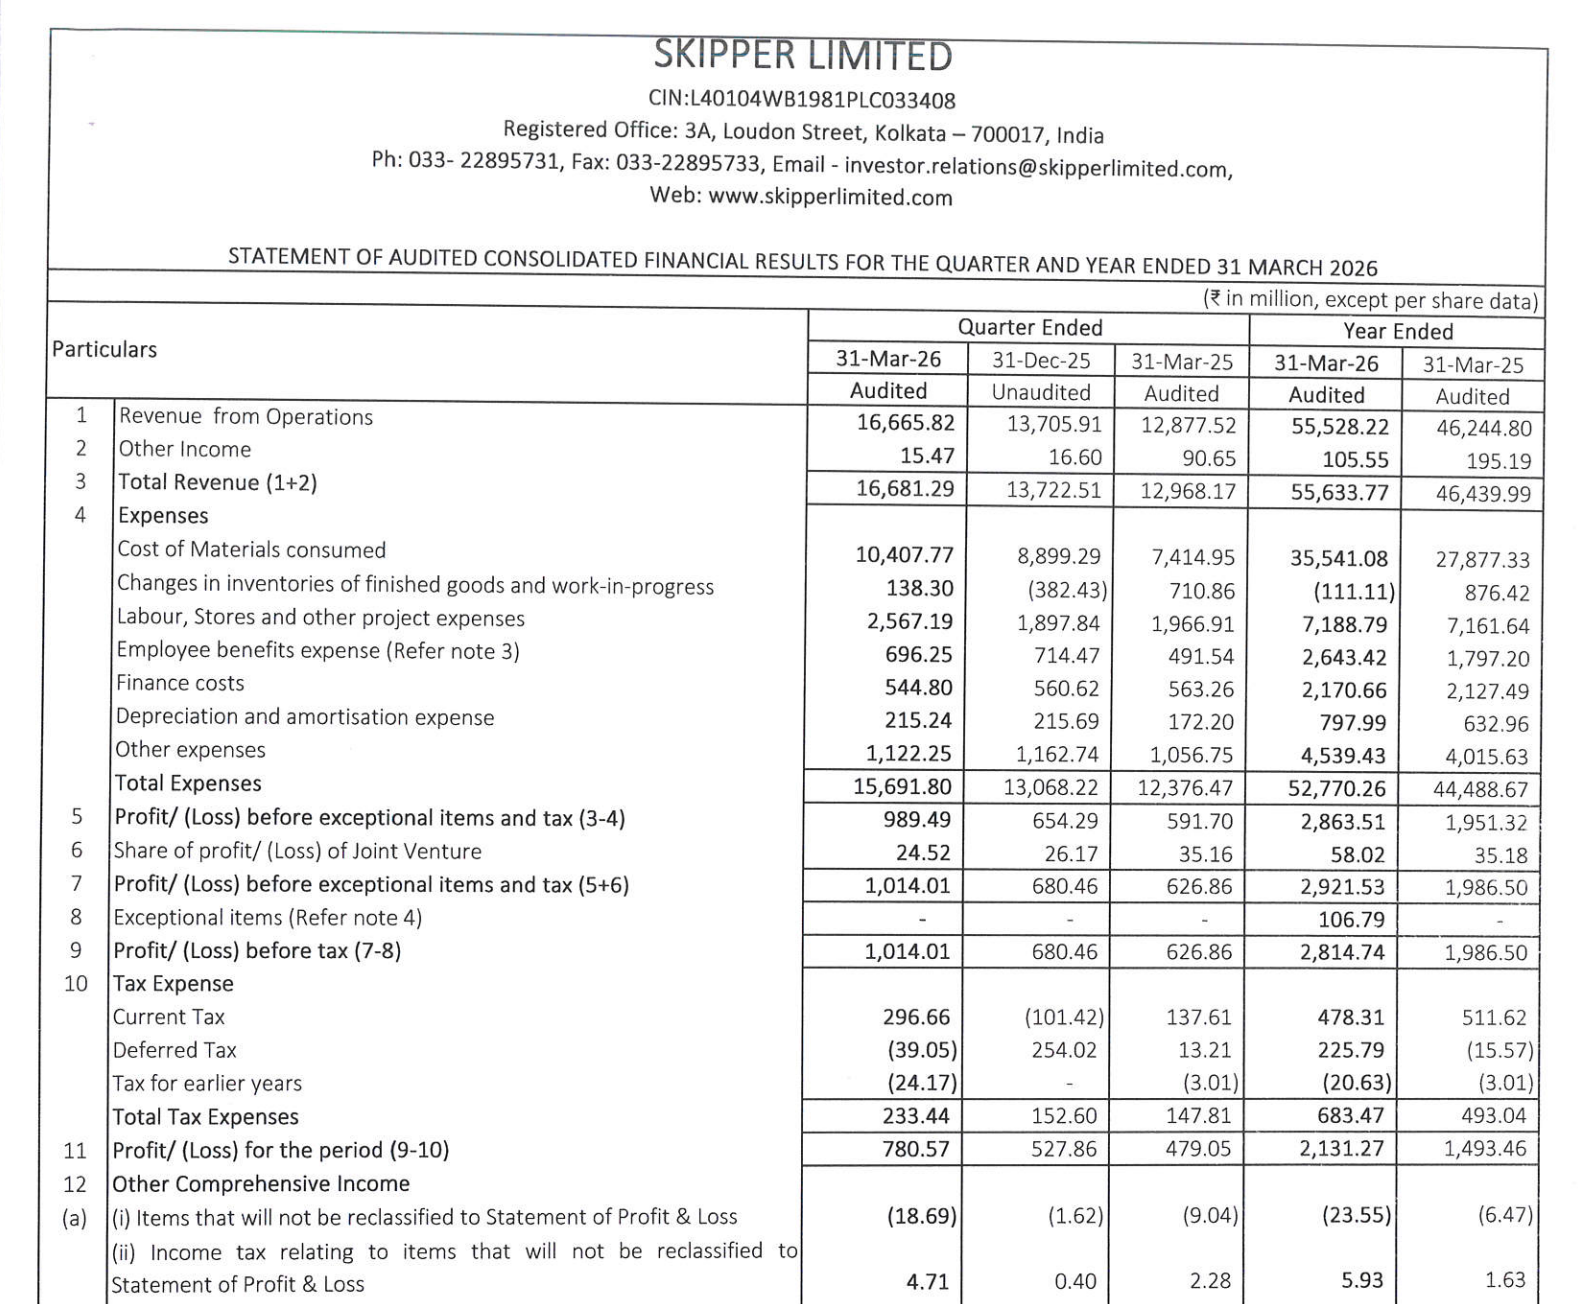
Skipper delivered solid top-line growth driven by Engineering and Infra segments, but margin pressure and rising finance costs limited profit expansion
key financial highlights
- Revenue from Operations:
- Revenue (Q4 FY26): ₹16,665.82 million
- QoQ Change: +21.6%
- YoY Change: +29.4%
- Previous Quarter (Q3 FY26): ₹13,705.91 million
- Previous Year (Q4 FY25): ₹12,877.52 million
- Revenue (Q4 FY26): ₹16,665.82 million
- Profit After Tax (PAT):
- PAT (Q4 FY26): ₹780.57 million
- QoQ Change: +9.0%
- YoY Change: +53.7%
- Previous Quarter (Q3 FY26): ₹527.86 million
- Previous Year (Q4 FY25): ₹479.05 million
- PAT (Q4 FY26): ₹780.57 million
- QoQ Performance
- Revenue Trend: Strong growth
- Profit Trend: Strong Recovery
Margin Analysis
Key Drivers:
- Increase in raw material consumption (steel-heavy business impact)
- Higher finance costs due to increased borrowings
- Operating leverage benefits partially offset cost pressures
Key Signal: Revenue growth is strong, but margin expansion is constrained due to cost structure
Segment performance
Segment: Engineering Products
Revenue: ₹12,487.38 Mn
Insights:
- Major contributor (~75% of revenue)
- Strong YoY and QoQ growth
- Core driver of profitability
Segment: Polymer Products
Revenue: ₹1,599.82 Mn
Insights:
- Moderate growth segment
- Lower margin compared to engineering
Segment: Infrastructure Projects
Revenue: ₹2,578.62 Cr
Insights:
- Stable contribution
- Growth driven by project execution
Segment insight
Summary:
- Engineering segment dominates revenue and profitability, indicating strong positioning in transmission & distribution infrastructure
Characteristics:
- High dependence on engineering segment
- Diversified but engineering-led business model
- Infra projects add execution-based volatility
Earning quality check
Drivers:
- Growth supported by core operations (not one-off gains)
- Limited exceptional items
- High finance cost impacting net profitability
Interpretation:
- Earnings are operationally driven but slightly pressured by leverage and cost factors
balance sheet Analysis
- Total Assets: ₹45,333.04 million
- Total Liabilities: ₹30,420.75 million
Insight:
- Significant increase in borrowings indicates expansion phase
- Working capital intensity remains high
- Balance sheet is leveraged but aligned with growth strategy
key risks
- High dependence on steel prices (raw material volatility)
- Rising debt and finance cost burden
- Working capital-intensive business
- Execution risk in infrastructure projects
management strategy signals
Focus Area:
- Expansion in engineering and infrastructure segments
- Scaling export opportunities
- Capacity expansion and project execution
Financial Metrics
| Particular | Q4 FY26 | Q.O.Q | Y.O.Y |
|---|---|---|---|
| Total Income | ₹16,681.29 Million | +21.6% | +28.6% |
| PBT | ₹1,014.01 Million | +49.1% | +61.7% |
| PAT | ₹780.57 Million | +47.9% | +62.9% |
Skipper Limited is in a strong growth phase, driven by robust demand in engineering and infrastructure. However, margin pressure and rising leverage are key concerns. The company remains fundamentally strong, but sustainability of margins and debt management will be critical going forward.
Official Exchange Filing: Skipper Limited
Quarterly Performance Context
FISCAL YEAR
2025-2026
AUDIT STATUS
REVIEWED