Quarter Ended: March 2026
Supreme Industries Ltd – Q4 FY26 Consolidated Results Analysis
NSE
supremeind
BSE
509930
Sequential performance improved sharply across revenue and profitability, driven by segment recovery, but YoY growth remains moderate indicating cyclical pressures
key financial highlights
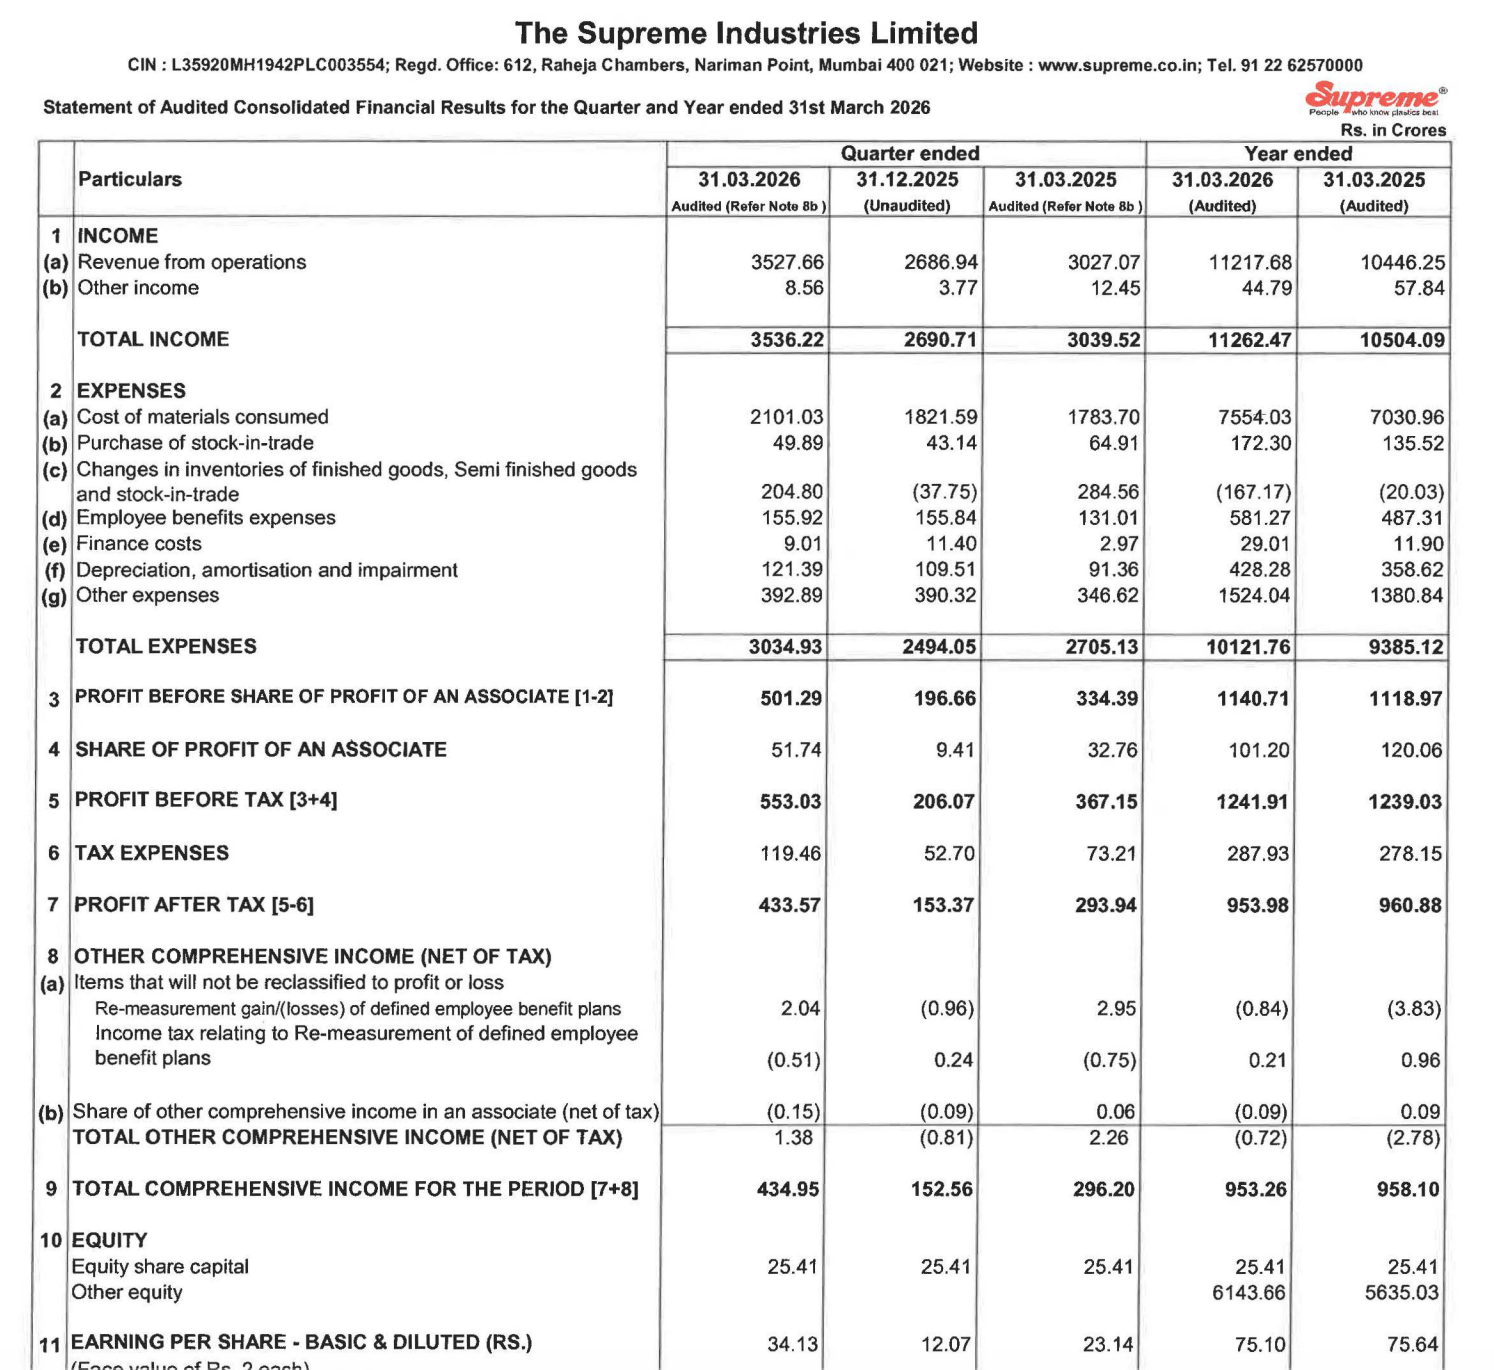
- Revenue from Operations:
- Total Income (Q4 FY26): ₹3,527.66 Cr
- QoQ Change: +31.30%
- YoY Change: +16.51%
- Previous Quarter (Q3 FY26): ₹2,686.94 Cr
- Previous Year (Q4 FY25): ₹3,027.07 Cr
- Total Income (Q4 FY26): ₹3,527.66 Cr
- Profit After Tax (PAT):
- PAT (Q4 FY26): ₹433.57 Cr
- QoQ Change: +182.74%
- YoY Change: +47.50%
- Previous Quarter (Q3 FY26): ₹153.37 Cr
- Previous Year (Q4 FY25): ₹293.94 Cr
- PAT (Q4 FY26): ₹433.57 Cr
- QoQ Performance
- Revenue Trend: Strong rebound
- Profit Trend: Sharp expansion
Margin Analysis
Key Drivers:
- Operating leverage from higher volumes
- Controlled input costs relative to revenue growth
- Better segment mix (higher contribution from piping & packaging)
Key Signal: Margin expansion is visible with profits growing faster than revenue
Segment performance
Segment: Plastics Piping Products
- Revenue: ₹2,558.26 Cr
Insights:
- Major revenue contributor
- Strong QoQ growth
Segment: Industrial Products
- Revenue: ₹358.51 Cr
Insights:
- Stable Performance
Segment: Packaging Products
- Revenue: ₹456.92 Cr
Insights:
- Consistent growth driver
Segment: Consumer Products
- Revenue: ₹123.48 Cr
Insights:
- Smaller but stable segment
Segment: Other
- Revenue: ₹30.49 Cr
Insights:
- Minor contribution
Segment insight
Summary:
- Growth is driven primarily by core plastics piping segment with support from packaging and industrial segments
Characteristics:
- Core segment dominance
- Diversified product mix
- Cyclical demand influence
Earning quality check
Drivers:
- Core operating profit growth
- Contribution from associate income
- Limited reliance on non-operating income
Interpretation:
- Earnings quality is healthy with operational strength, though some contribution from associate income exists
balance sheet Analysis
- Total Assets: ₹7,794.89 Cr
- Total Liabilities: ₹1,625.82 Cr (Derived)
Insight:
- Strong equity base with manageable liabilities indicates a stable financial structure
key risks
- Raw material price volatility (PVC, polymers)
- Demand cyclicality in infrastructure & housing
- Working capital fluctuations
management strategy signals
- Focus Areas:
- Capacity expansion in piping segment
- Product diversification
- Cost efficiency and margin protection
Financial Metrics
| Particular | Q4 FY26 | Q.O.Q | Y.O.Y |
|---|---|---|---|
| Total Income | ₹3,527.66 Crore | +31.30% | +16.51% |
| PBT | ₹553.03 Crore | +168.38% | +50.60% |
| PAT | ₹433.57 Crore | +182.74% | +47.50% |
Supreme Industries delivered a strong sequential recovery quarter, with significant improvement in profitability and margins. While YoY growth is steady, the sharp QoQ momentum suggests demand revival. Sustainability of margins and raw material trends remain key monitorables.
Official Exchange Filing: Supreme Industries Ltd
Quarterly Performance Context
FISCAL YEAR
2025-2026
AUDIT STATUS
REVIEWED