Quarter Ended: March 2026
Vedanta Ltd. – Q4 FY26 Results
NSE
vedl
BSE
500295
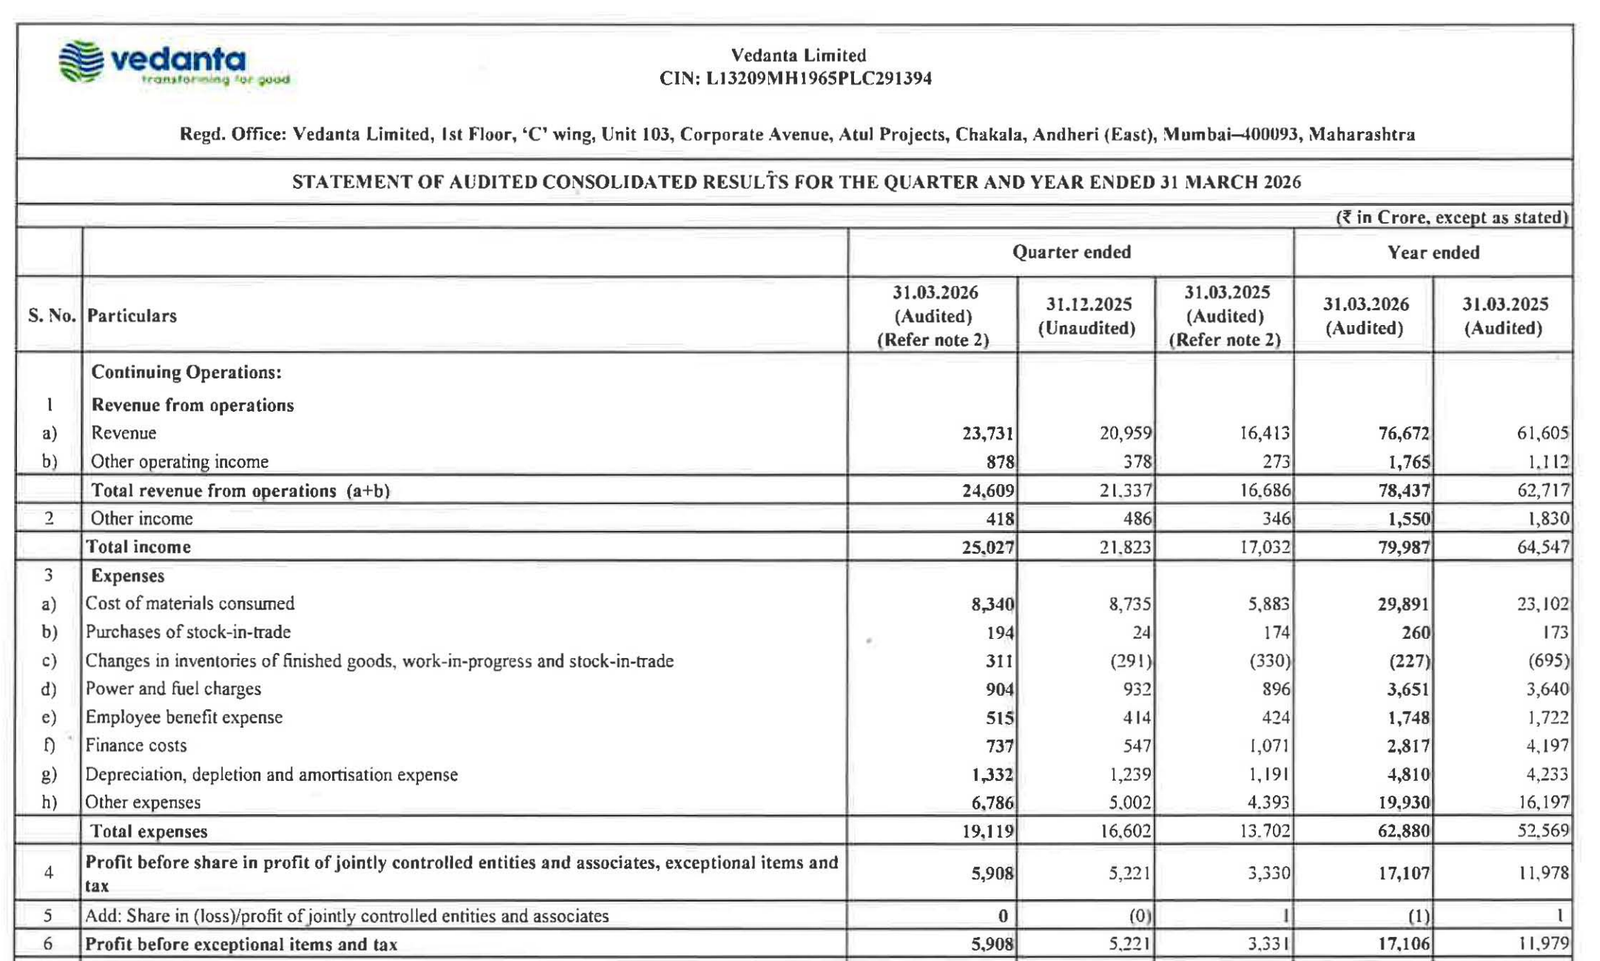
Vedanta delivered strong operational growth across key segments like Aluminium and Zinc, with sharp improvement in profitability. However, balance sheet compression and reliance on financing activities keep the outlook balanced
key financial highlights
- Revenue from Operations:
- Revenue (Q4 FY26): ₹25,027 Cr
- QoQ Change: +14.68%
- YoY Change: +46.96%
- Previous Quarter (Q3 FY26): ₹21,823 Cr
- Previous Year (Q4 FY25): ₹17,032 Cr
- Revenue (Q4 FY26): ₹25,027 Cr
- Profit After Tax (PAT):
- PAT (Q4 FY26): ₹9,352 Cr
- QoQ Change: +19.80%
- YoY Change: +88.52%
- Previous Quarter (Q3 FY26): ₹7,807 Cr
- Previous Year (Q4 FY25): ₹4,961 Cr
- PAT (Q4 FY26): ₹9,352 Cr
- QoQ Performance
- Revenue Trend: Strong growth
- Profit Trend: Strong growth
Margin Analysis
Key Drivers:
- Higher commodity realizations
- Improved operating leverage
- Lower finance cost (YoY decline visible)
- Contribution from discontinued operations
Key Signal: Operating strength is visible, but profit boost partially driven by restructuring/discontinued segments
Segment insight
Summary:
- Vedanta continues to operate as a diversified natural resources company
Performance driven by:
- Commodity cycles
- Production volumes
- Global pricing
Earning quality check
Drivers:
- Strong operating profit growth
- Significant contribution from:
- Discontinued operations (₹5,102 Cr in Q4)
- Exceptional items impact minimal in FY26
Interpretation:
- Core operations improving
- But one-off / structural impacts present
balance sheet Analysis
- Total Assets: ₹2,33,237 Cr (vs ₹2,03,293 Cr)
- Total Equity: ₹68,577 Cr (vs ₹53,753 Cr)
- Non-current Liabilities: ₹23,722 Cr (vs ₹75,965 Cr)
- Current Liabilities: ₹35,023 Cr (vs ₹73,575 Cr)
Insight:
- Massive reduction in liabilities → Deleveraging signal
- Large assets classified as “held for distribution” → ₹1,59,240 Cr
- Sharp drop in fixed assets (PPE: ₹97,834 → ₹30,027 Cr)
key risks
- Commodity price volatility
- High dependence on global demand cycles
- Structural changes (demerger impact uncertainty)
- Regulatory risks in mining & energy sectors
management strategy signals
Focus Area:
- Business restructuring (demerger/unlocking value)
- Debt reduction
- Capital allocation optimization
- Focus on core high-margin segments
Financial Metrics
| Particular | Q4 FY26 | Q.O.Q | Y.O.Y |
|---|---|---|---|
| Total Income | ₹25,027 Crore | +14.68% | +46.96% |
| PBT | ₹5,908 Crore | +13.15% | +77.41% |
| PAT | ₹9,352 Crore | +19.78% | +88.53% |
Vedanta delivered a strong quarter backed by both operational growth and structural changes.
Official Exchange Filing: Vedanta Limited
Quarterly Performance Context
COST OF OPERATIONS AS % OF REVENUE
76%
NET PROFIT AS % OF REVENUE
37%
FISCAL YEAR
2025-2026
AUDIT STATUS
REVIEWED