Quarter Ended: March 2026
Bajaj Finserv Ltd – Q4 FY26 Results
NSE
BAJAJFINSV
BSE
532978
Robust revenue and profit growth driven by insurance and lending segments, though rising credit costs and negative operating cash flows remain key monitorables
key financial highlights
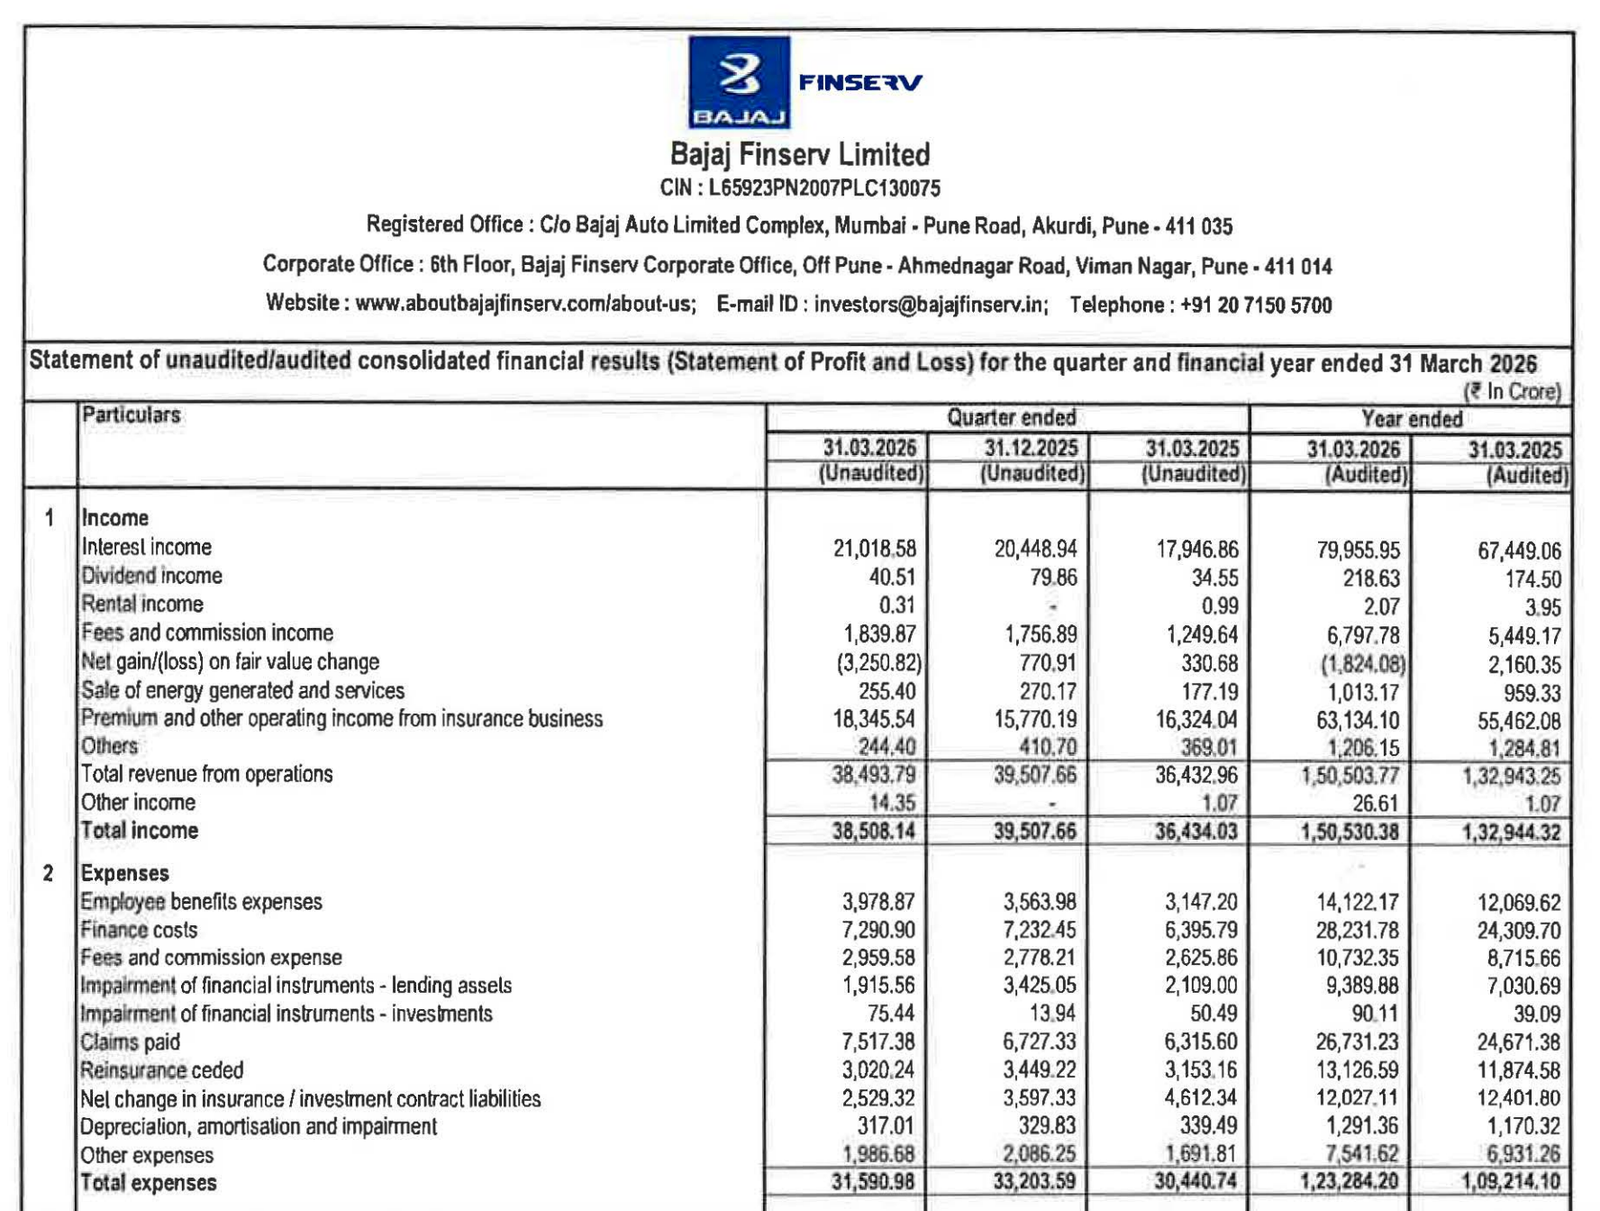
- Revenue from Operations:
- Total Income (Q4 FY26): ₹38,508.14 Cr
- QoQ Change: -2.5%
- YoY Change: +5.7%
- Previous Quarter (Q3 FY26): ₹39,507.66 Cr
- Previous Year (Q4 FY25): ₹36,434.03 Cr
- Total Income (Q4 FY26): ₹38,508.14 Cr
- Profit After Tax (PAT):
- PAT (Q4 FY26): ₹2,538.67 Cr
- QoQ Change: +13.9%
- YoY Change: +5.0%
- Previous Quarter (Q3 FY26): ₹2,229.15 Cr
- Previous Year (Q4 FY25): ₹2,416.64 Cr
- PAT (Q4 FY26): ₹2,538.67 Cr
- QoQ Performance
- Revenue Trend: Slight decline
- Profit Trend: Strong improvement
Margin Analysis
Drivers:
- Growth in high-margin insurance business
- Elevated finance costs (₹7,290 Cr) impacting margins
- Increase in impairment costs
Insight:
- Margins stable but under pressure due to rising credit costs and financing expenses
Segment performance
Segment: Insurance
- Revenue: ₹17,058.51 Cr
- Major growth contributor
- Life + General insurance driving scale
Segment: Retail Financing
- Revenue: ₹21,606.51 Cr
- Core earnings engine
- Strong growth but higher risk exposure
Segment: Investments & Other
- Revenue: ₹496.33 Cr
- Minor contribution
Segment insight
Summary:
- Bajaj Finserv remains a diversified financial conglomerate with strong dual engines: lending + insurance
Charcateristics:
- Credit-driven growth model
- Insurance provides stability + margin support
- High dependence on economic cycle
Earning quality check
Drivers:
- Strong operating profit growth
- Rising impairment on financial instruments
- Dependence on lending spreads
Interpretations:
- Earnings are strong but slightly risk-adjusted due to credit cycle exposure
balance sheet Analysis
- Total Assets: ₹7,58,497.54 Cr
- Total Liabilities: ₹6,08,320.92 Cr
Insight:
- Large and expanding balance sheet reflecting aggressive credit growth; leverage is inherent to NBFC structure
Cash flow analysis
Operating Cash Flow: ₹(55,301.41 Cr) → Negative
Investing Cash Flow: ₹(12,634.87 Cr)
Financing Cash Flow: ₹66,610.32 Cr
Insight:
- Negative operating cash flow is typical for lending businesses due to loan book expansion; funding supported via financing inflows.
key risks
- Rising NPAs / credit costs
- Interest rate sensitivity
- Regulatory changes in financial services
- Insurance claim volatility
management strategy signals
Focus Area:
- Expansion in retail lending
- Strengthening insurance penetration
- Digital financial ecosystem
Financial metrics table
| Particular | Q4 FY26 | Q.O.Q | Y.O.Y |
|---|---|---|---|
| Revenue | ₹38,508.14 Cr | -2.5% | +5.7% |
| Total Expense | ₹31,590.98 Cr | -4.8% | +3.8% |
| Net Profit | ₹2,538.67 Cr | +13.9% | +5.0% |
Bajaj Finserv continues to deliver consistent growth backed by strong lending and insurance businesses. However, rising credit costs and negative operating cash flows indicate increasing dependence on funding markets. The long-term story remains intact, but near-term risk lies in asset quality trends.
Official Exchange Filing: Bajaj Finders Ltd
Quarterly Performance Context
FISCAL YEAR
2025-2026
AUDIT STATUS
REVIEWED