Quarter Ended: March 2026
National Aluminium Company Ltd (NALCO) – Q4 FY26 Results
NSE
NATIONALUM
BSE
532234
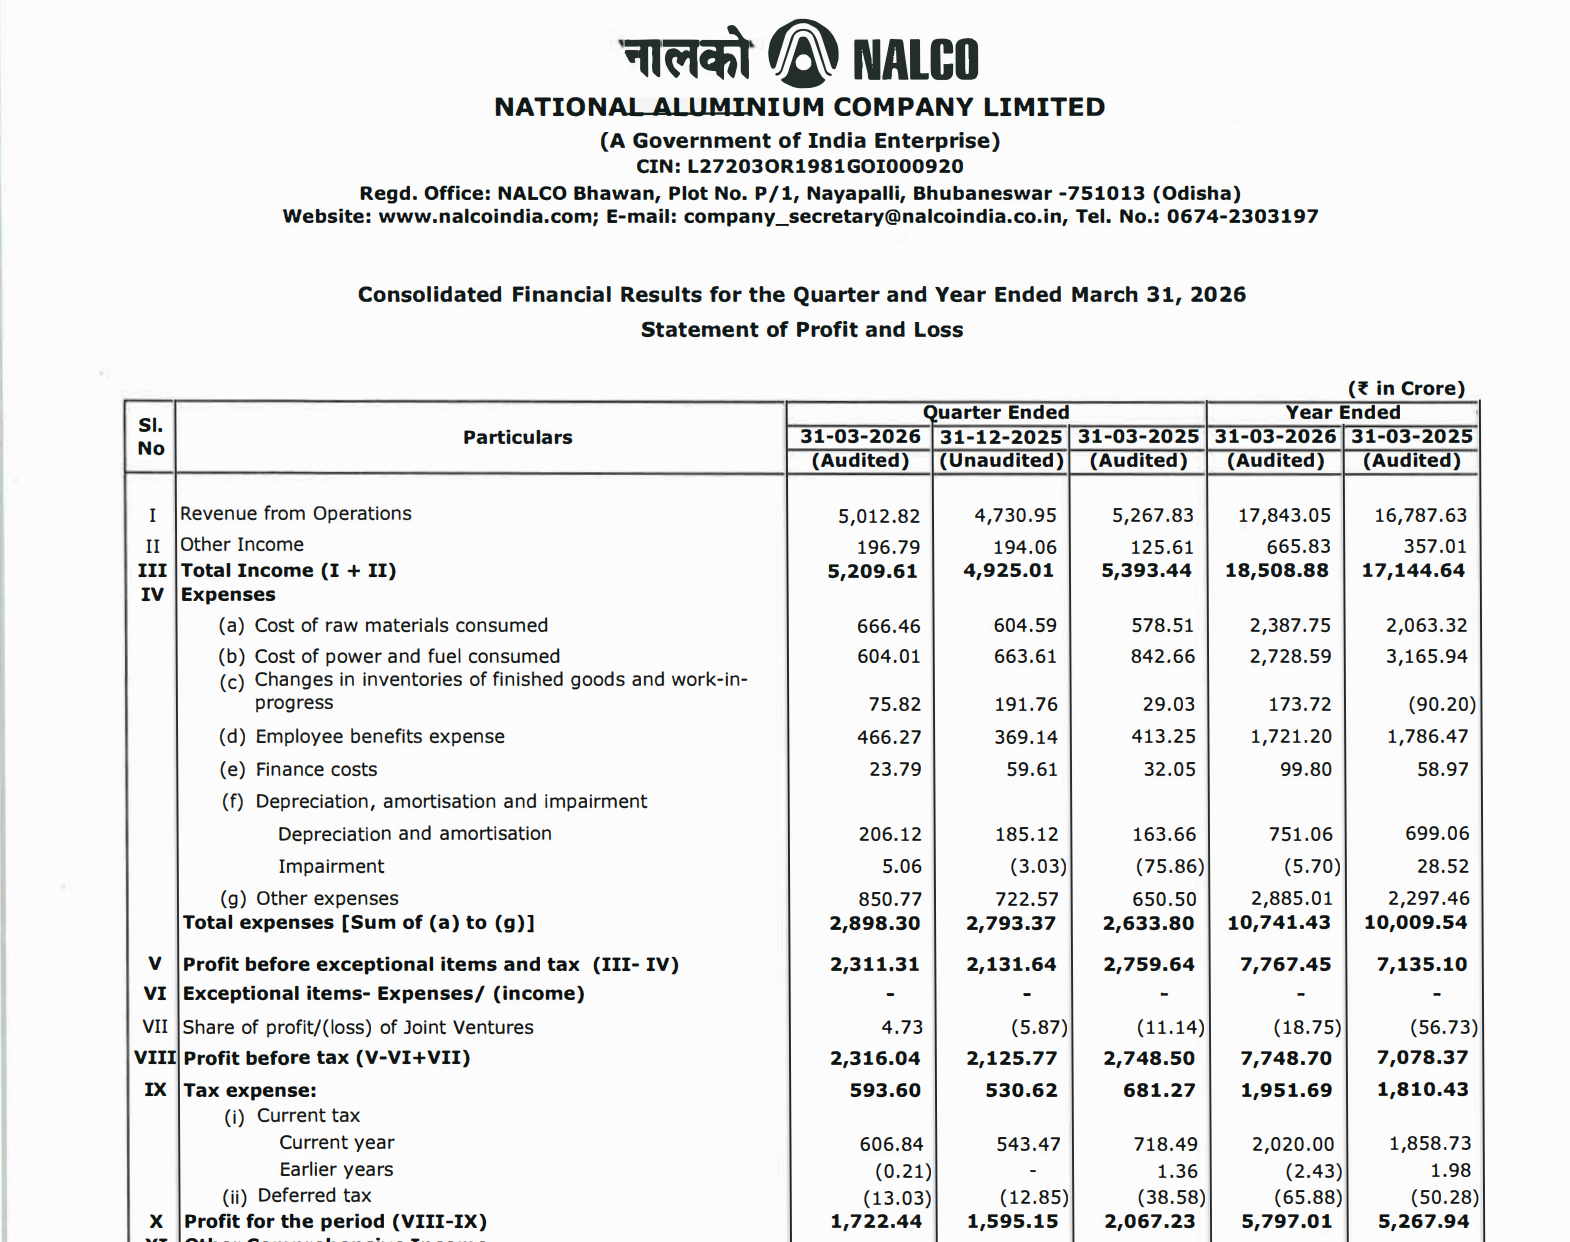
NALCO delivered stable topline growth QoQ, but rising cost structure and commodity normalization led to YoY profit decline.
key financial highlights
- Revenue from Operations:
- Revenue (Q4 FY26): ₹5,012.82 Cr
- QoQ Change: +6.0%
- YoY Change: -4.8%
- Previous Quarter (Q3 FY26): ₹4,730.95 Cr
- Previous Year (Q4 FY25): ₹5,267.83 Cr
- Revenue (Q4 FY26): ₹5,012.82 Cr
- Profit After Tax (PAT):
- PAT (Q4 FY26): ₹1,722.44 Cr
- QoQ Change: +7.9%
- YoY Change: -16.7%
- Previous Quarter (Q3 FY26): ₹1,595.15 Cr
- Previous Year (Q4 FY25): ₹2,067.23 Cr
- PAT (Q4 FY26): ₹1,722.44 Cr
- QoQ Performance
- Revenue Trend: Improved
- Profit Trend: Improved
Margin Analysis
Drivers:
- Increase in power & fuel cost
- Higher raw material consumption cost
- Moderation in aluminium realizations
Insight:
- Margins are compressing YoY, indicating cost pressure despite stable operations
Segment performance
Segment: Aluminium
- Revenue: ₹3,894.52 Cr
- Insights:
- Core revenue contributor (~75%)
- Strong QoQ recovery
- Sensitive to global aluminium prices
Segment: Chemical
- Revenue: ₹1,575.31 Cr
- Insights:
- Stable but declining YoY
- Lower margin compared to aluminium
Segment insight
Summary:
- NALCO operates in a commodity-driven structure where aluminium dominates revenue and profitability
Charcateristics:
- Highly cyclical earnings
- Dependent on global metal prices
- Energy-intensive operations
- PSU-driven strategic decisions
Earning quality check
Drivers:
- No major exceptional items
- Core operations driving earnings
- Stable cash-backed profits
Interpretations:
- Earnings are clean but cyclical, with no artificial boost
balance sheet Analysis
- Total Assets: ₹26,544.40 Cr
- Total Liabilities: ₹4,940.69 Cr
Insight:
- Strong balance sheet with low leverage and high equity base
key risks
- Aluminium price volatility
- Rising energy costs
- Global demand slowdown
- PSU policy-related constraints
management strategy signals
Focus Area:
- Cost optimization (especially power efficiency)
- Increasing production efficiency
- Expansion into value-added products
Financial metrics table
| Particular | Q4 FY26 | Q.O.Q | Y.O.Y |
|---|---|---|---|
| Revenue | ₹5,012.82 Cr | +6.0% | -4.8% |
| Total Expense | ₹2,898.30 Cr | +3.8% | +10.0% |
| Net Profit | ₹1,722.44 Cr | +7.9% | -16.7% |
NALCO remains financially strong with robust cash flows and a solid balance sheet. However, profitability is entering a cyclical downtrend due to rising costs and softer commodity pricing. Future performance will depend heavily on aluminium price trends and energy cost control.
Official Exchange Filing: National Aluminium Company Limited
Quarterly Performance Context
COST OF OPERATIONS AS % OF REVENUE
58%
NET PROFIT AS % OF REVENUE
34%
FISCAL YEAR
2025-2026
AUDIT STATUS
REVIEWED