Quarter Ended: March 2026
Aster DM Healthcare – Q4 FY26 Results
NSE
asterdm
BSE
540975
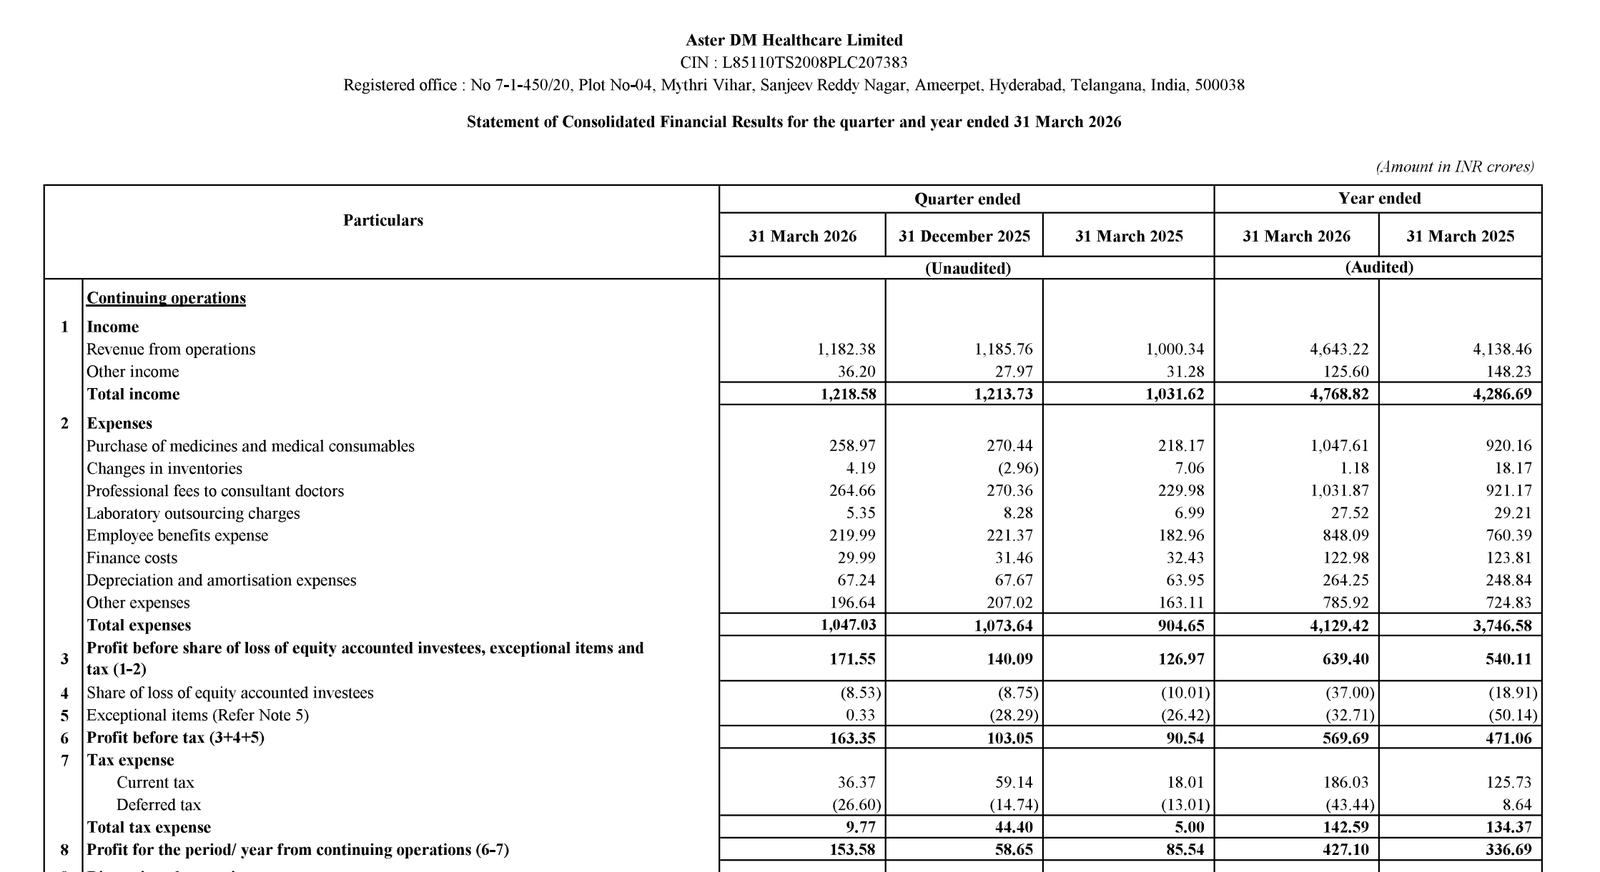
Profitability improved significantly despite modest revenue growth, driven by better cost efficiency and operating leverage
key financial highlights
- Revenue from Operations:
- Revenue (Q4 FY26): ₹1,218.58 Cr
- QoQ Change: +0.40%
- YoY Change: +18.12%
- Previous Quarter (Q3 FY26): ₹1,213.73 Cr
- Previous Year (Q4 FY25): ₹1,031.62 Cr
- Revenue (Q4 FY26): ₹1,218.58 Cr
- Profit After Tax (PAT):
- PAT (Q4 FY26): ₹153.58 Cr
- QoQ Change: +161.86%
- YoY Change: +79.54%
- Previous Quarter (Q3 FY26): ₹58.65 Cr
- Previous Year (Q4 FY25): ₹85.54 Cr
- PAT (Q4 FY26): ₹153.58 Cr
- QoQ Performance
- Revenue Trend: Stable
- Profit Trend: Strong Increase
Margin Analysis
Drivers:
- Operating leverage from stable revenue base
- Lower effective tax vs previous quarter
- Controlled expense growth
Insight:
- Profit expansion significantly outpaced revenue → margin expansion visible
Segment performance
Segment: Hospital & Clinics
- Revenue: ₹1,152.56 Cr
- Core revenue driver with consistent growth
Segment: Labs
- Revenue: ₹38.51 Cr
- Stable contribution
Segment: Wholesale Pharmacies
- Revenue: ₹19.77 Cr
- Marginal contributor
Segment: Other
- Revenue: ₹5.17 Cr
Segment insight
Summary:
- Healthcare delivery (Hospitals & Clinics) dominates revenue mix, indicating strong core business stability
Charcateristics:
- High dependency on hospital segment
- Diversification present but limited impact from non-core segments
- Stable segment mix supports predictable earnings
Earning quality check
Drivers:
- Strong operating profit growth
- No major exceptional income in quarter
- Consistent revenue base
Interpretations:
- Earnings quality is healthy and sustainable, driven primarily by core operations rather than one-offs
balance sheet Analysis
- Total Assets: ₹8,111.96 Cr
- Total Liabilities: ₹3,278.26 Cr
Insight:
- Strong asset growth vs last year (~₹6,606 Cr → ₹8,111 Cr) indicates expansion
- Balance sheet remains stable with controlled liabilities
key risks
- High dependence on hospital segment
- Rising finance cost pressure
- Healthcare regulatory changes
- Execution risk in expansion strategy
Financial metrics table
| Particular | Q4 FY26 | Q.O.Q | Y.O.Y |
|---|---|---|---|
| Total Income | ₹1,218.58 Cr | +0.40% | +18.12% |
| PBT | ₹163.35 Cr | +58.54% | +80.42% |
| PAT | ₹153.58 Cr | +161.86% | +79.54% |
Aster DM delivered a strong profitability quarter with sharp PAT growth and stable revenue. Margin expansion and operational efficiency are clear positives, making the results fundamentally strong with positive bias.
Official Exchange Filing: Aster DM Healthcare Limited
Quarterly Performance Context
COST OF OPERATIONS AS % OF REVENUE
86%
NET PROFIT AS % OF REVENUE
13%
FISCAL YEAR
2025-2026
AUDIT STATUS
REVIEWED