Quarter Ended: March 2026
TVS Motor Company Limited – Q4 FY26 Results
NSE
tvsmotor
BSE
532343
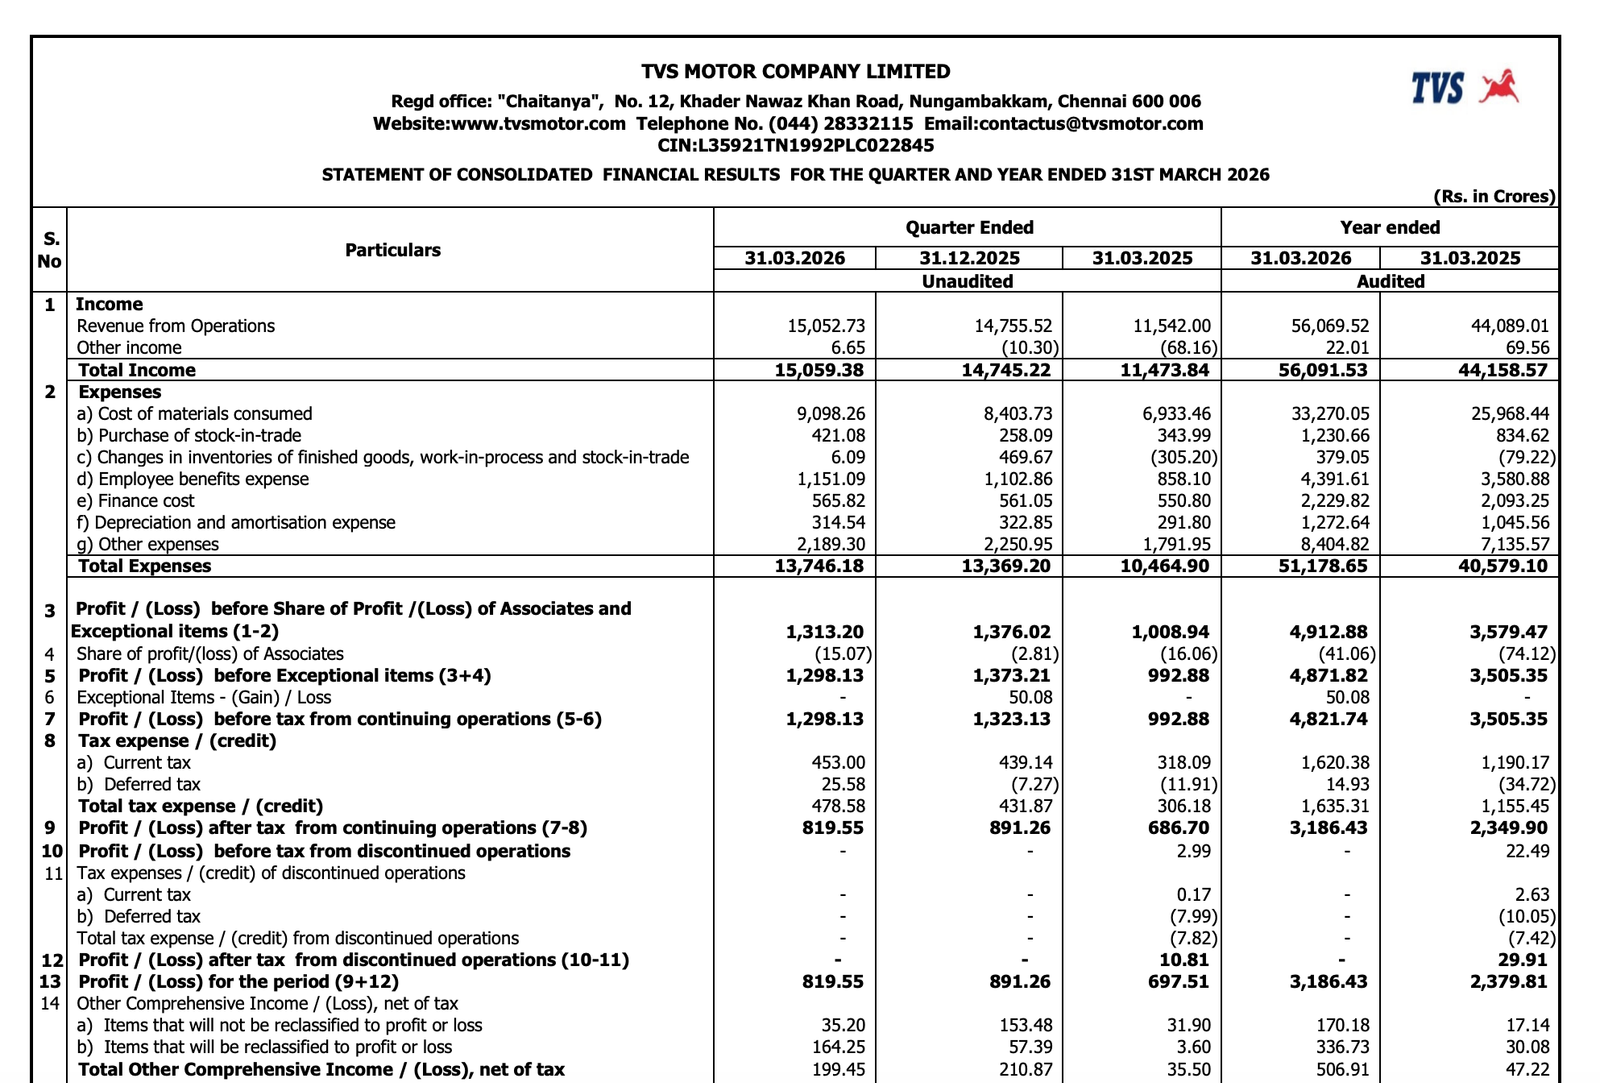
TVS Motor delivered another strong quarter with double-digit revenue growth and healthy profitability expansion led by automotive business momentum, premiumisation, and financial services growth.
key financial highlights
- Revenue from Operations:
- Revenue (Q4 FY26): ₹15,052.73 Cr
- QoQ Change: +2.01%
- YoY Change: +30.42%
- Previous Quarter (Q3 FY26): ₹14,755.52 Cr
- Previous Year (Q4 FY25): ₹11,542.00 Cr
- Revenue (Q4 FY26): ₹15,052.73 Cr
- Profit After Tax (PAT):
- PAT (Q4 FY26): ₹819.55 Cr
- QoQ Change: -8.05%
- YoY Change: +17.50%
- Previous Quarter (Q3 FY26): ₹891.26 Cr
- Previous Year (Q4 FY25): ₹697.51 Cr
- PAT (Q4 FY26): ₹819.55 Cr
- QoQ Performance:
- Revenue: Positive
- Profit: Slightly Negative
Margin Analysis
Drivers:
- Strong revenue growth improved operating leverage
- Premium motorcycle and scooter contribution supported margins
- Employee and other operating expenses increased during the quarter
- Finance costs remained elevated due to expansion in financial services business
- Operating margin remained healthy despite cost inflation
Insight:
- Revenue growth continued outpacing cost escalation, helping sustain profitability and operational strength.
Segment performance
Segments: Automotive Vehicles & Parts
- Revenue: ₹13,217.35 Cr
- Insights:
- Core automotive business remained the largest contributor
- Strong demand in premium motorcycles and scooters supported growth
- Export and domestic sales momentum stayed healthy
Segments: Financial Services
- Revenue: ₹1,847.33 Cr
- Insights:
- Financial services business continued expanding steadily
- Higher loan book and financing activities supported revenue growth
- Segment profitability remained strong despite funding costs
Segment insight
Business Summary:
TVS Motor now operates as a diversified mobility and financial services platform with automotive manufacturing continuing as the primary growth engine while financial services adds recurring profitability.
Key Characteristics:
- Strong two-wheeler market positioning
- Expanding premium segment portfolio
- Integrated financing ecosystem
- Export-oriented growth strategy
- Operational scale advantages
Earning quality check
Key Drivers:
- Annual PAT increased to ₹3,186.43 Cr
- Operating cash flow remained strong at ₹1,866.59 Cr
- Revenue growth remained broad-based across segments
- Higher working capital deployment supported business expansion
- Profitability backed by operational execution rather than exceptional gains
Interpretations:
- Earnings quality remains healthy as revenue growth, segment profitability, and operational cash generation collectively supported earnings expansion.
balance sheet Analysis
- Total Assets: ₹56,500.62 Cr
- Total Liabilities: ₹45,787.76 Cr
Insight:
- Total assets increased significantly from ₹47,936.91 Cr
- Loans receivable from financing activity rose sharply indicating NBFC expansion
- Equity strengthened to ₹10,712.86 Cr
- Current liabilities increased due to business scale expansion
- Debt-to-assets ratio improved slightly to 0.56x
Cash flow analysis
Operating Cash Flow:
- Net Cash from Operating Activities : ₹1,866.59 Cr
- Operating cash flow moderated due to higher working capital deployment and financing activity expansion.
Investing Cash Flow:
- Net Cash Used in Investing Activities : ₹2,964.47 Cr
- Key Observations:
- Significant capex and investment spending continued
- Investments in subsidiaries and associates increased
- Capacity expansion and technology investments remained active
Financing Cash Flow:
- Net Cash Used in Financing Activities : ₹909.33 Cr
- Key Observations:
- Borrowing growth supported financial services expansion
- Dividend payout continued
- Debt servicing ratios remained comfortable
key risks
- Rising competitive intensity in EV and premium motorcycle segments
- Commodity and raw material cost volatility
- Financing business credit risk exposure
- Interest rate sensitivity affecting NBFC operations
- Export market and currency fluctuation risks
management strategy signals
Focus Area:
- Premium motorcycle and scooter expansion
- EV portfolio development
- Strengthening financial services ecosystem
- Export market penetration
- Margin improvement through operational efficiency
Financial metrics table
| Particular | Q4 FY26 | Q.O.Q | Y.O.Y |
|---|---|---|---|
| Total Income | ₹15,059.38 Cr | +2.13% | +31.26% |
| PBT | ₹1,298.13 Cr | -1.89% | +30.74% |
| PAT | ₹819.55 Cr | -8.05% | +17.50% |
TVS Motor delivered another strong operational performance in Q4 FY26 with sustained revenue momentum, strong segment execution, and healthy profitability growth.
While sequential PAT softened slightly due to cost pressures and financing expansion, the company’s long-term growth trajectory remains robust through premiumisation, exports, EV initiatives, and financial services integration.
Official Exchange Filing: TVS Motor Limited
Quarterly Performance Context
FISCAL YEAR
2025-2026
AUDIT STATUS
REVIEWED