Quarter Ended: March 2026
Gland Pharma Limited – Q4 FY26 Results
NSE
gland
BSE
543245
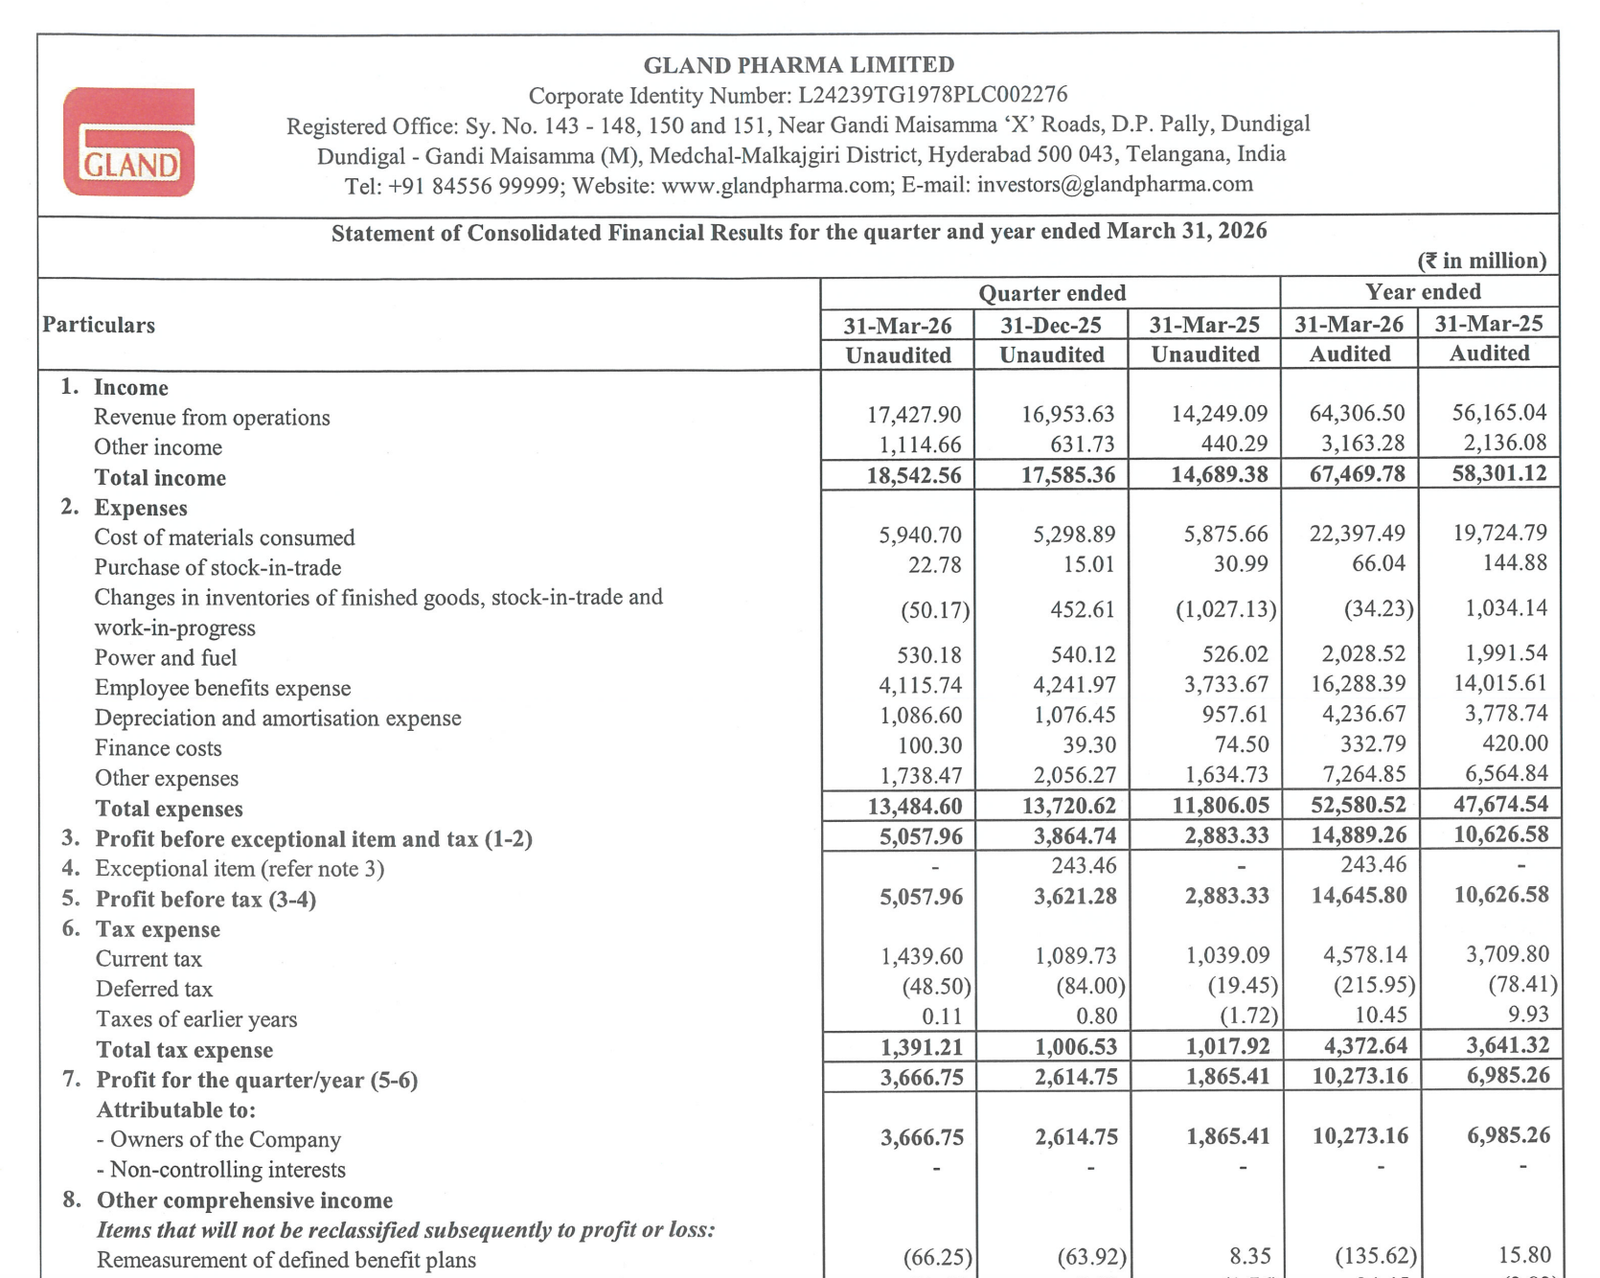
Gland Pharma Limited delivered a strong Q4 FY26 performance with robust growth in revenue and profitability driven by higher operational efficiency, improved product mix, and strong business momentum.
key financial highlights
- Revenue from Operations:
- Revenue (Q4 FY26): ₹17,427.90 Million
- QoQ Change: +2.80%
- YoY Change: +22.31%
- Previous Quarter (Q3 FY26): ₹16,953.63 Million
- Previous Year (Q4 FY25): ₹14,249.09 Million
- Revenue (Q4 FY26): ₹17,427.90 Million
- Profit After Tax (PAT):
- PAT (Q4 FY26): ₹3,666.75 Million
- QoQ Change: +40.24%
- YoY Change:+96.57%
- Previous Quarter (Q3 FY26): ₹2,614.75 Million
- Previous Year (Q4 FY25): ₹1,865.41 Million
- PAT (Q4 FY26): ₹3,666.75 Million
- QoQ Performance:
- Revenue Trend: Sequential revenue growth remained healthy despite a high operational base in previous quarters.
- Profit Trend: Profitability improved sharply QoQ supported by stable expenses and stronger operational margins.
- Revenue Trend: Sequential revenue growth remained healthy despite a high operational base in previous quarters.
Margin Analysis
Drivers:
- Better operational efficiency improved earnings conversion.
- Employee cost growth remained controlled relative to revenue expansion.
- Inventory adjustments supported margin improvement.
- Finance costs remained manageable.
- Higher scale supported operating leverage.
Insight:
- The company demonstrated meaningful improvement in profitability metrics, reflecting stronger business execution and margin stability.
Earning quality check
Key Drivers:
- Strong operating cash flow generation.
- Net cash generated from operations increased YoY.
- Healthy cash reserves on balance sheet.
- Strong profitability conversion into free cash flow.
- Low leverage profile maintained.
Interpretations:
- Earnings quality remained strong with substantial operational cash generation and improving profitability supported by core business performance.
balance sheet Analysis
- Total Assets: ₹125,108.48 Million
- Total Liabilities: ₹16,084.03 Million
Insight:
- The company maintained a very strong balance sheet with substantial cash reserves, high equity base, and low financial leverage, supporting future expansion and stability.
key risks
- Regulatory risks in international pharmaceutical markets.
- Pricing pressure in generic drug segments.
- Currency fluctuation risks due to export exposure.
- Compliance and manufacturing audit risks.
- Competitive pressure in injectable products.
- Dependence on regulated market approvals.
management strategy signals
Focus Area:
- Expanding global pharmaceutical presence.
- Improving manufacturing scale and efficiencies.
- Strengthening injectable product portfolio.
- Enhancing regulated market penetration.
- Maintaining compliance and quality standards.
- Driving operational excellence and margin expansion.
Financial metrics table
| Particular | Q4 FY26 | Q.O.Q | Y.O.Y |
|---|---|---|---|
| Total Income | ₹18,542.56 Million | +5.44% | +26.23% |
| PBT | ₹5,057.96 Million | +39.68% | +75.42% |
| PAT | ₹3,666.75 Million | +40.24% | +96.57% |
Gland Pharma Limited delivered a strong Q4 FY26 performance with substantial growth in both revenue and profitability. The company continues to maintain a strong balance sheet, healthy operational cash flows, and improving earnings quality, positioning it well for future growth in regulated pharmaceutical markets.
Official Exchange Filing: Gland Pharma Limited
Quarterly Performance Context
COST OF OPERATIONS AS % OF REVENUE
73%
NET PROFIT AS % OF REVENUE
21%
FISCAL YEAR
2025-2026
AUDIT STATUS
REVIEWED