Quarter Ended: March 2026
Jio Financial Services – Q4 FY26 Results Analysis
NSE
jiofin
BSE
543940
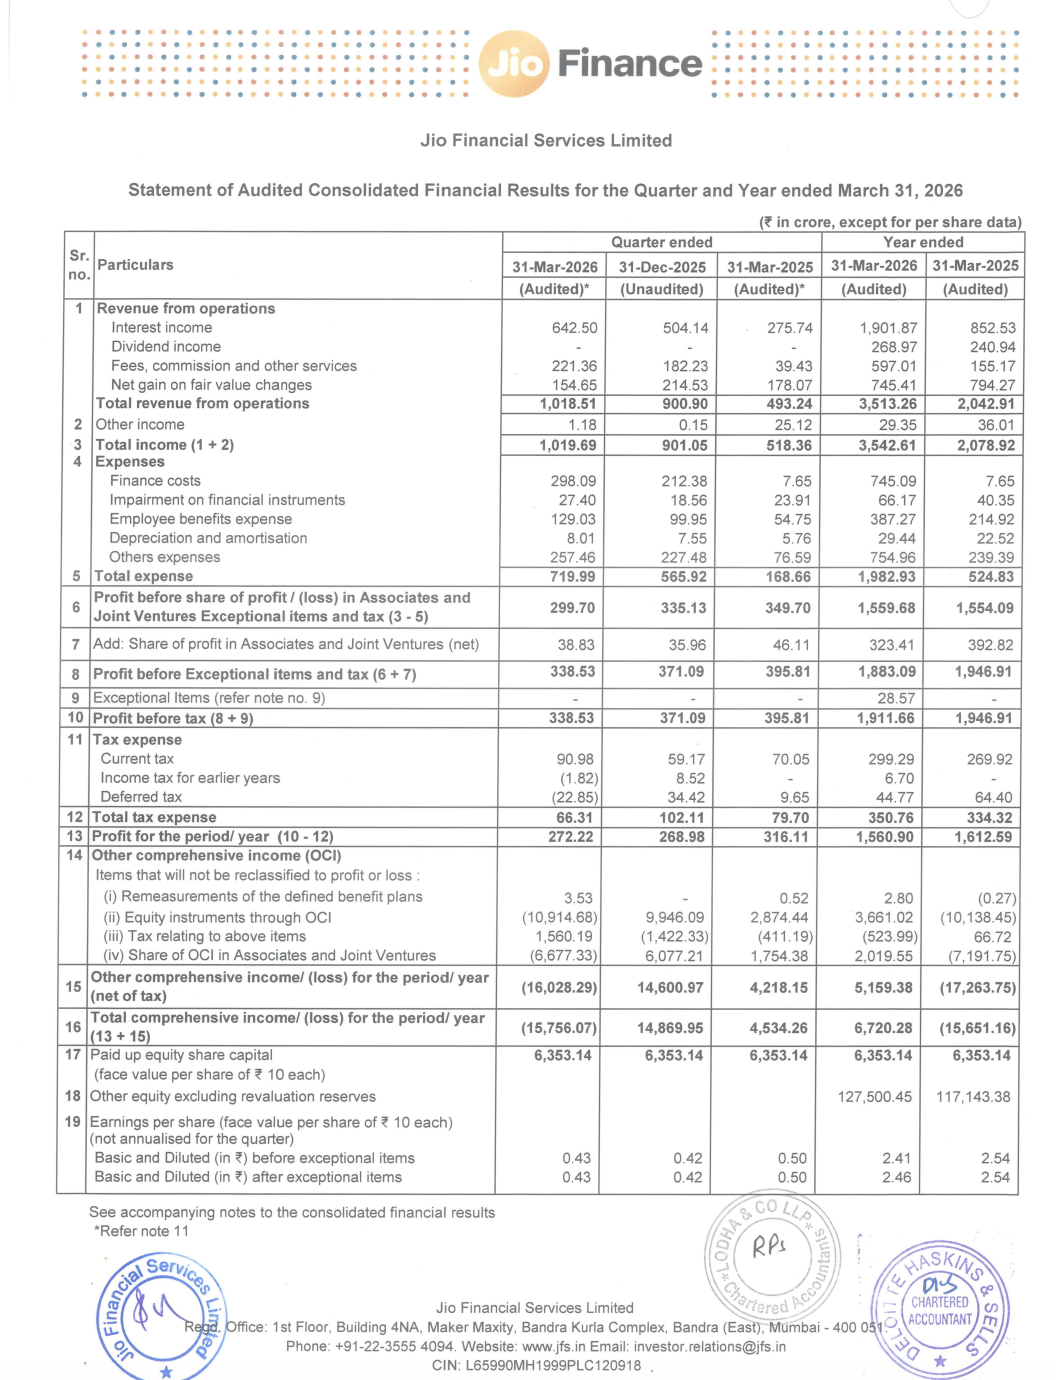
Core operating performance improved materially, led by higher interest income, loan book growth, and expansion in financing activities. However, mark-to-market volatility in OCI created noise in reported comprehensive income.
key financial highlights
- Revenue from Operations:
- Total Income (Q4 FY26): ₹1,019.69 crore
- QoQ Performance
- Previous Quarter: ₹901.05 crore
- Growth: +13.2%
- YoY Performance
- Previous Year: ₹518.36 crore
- Growth: +96.7%
- Profit After Tax (PAT):
- Current PAT: ₹272.22 crore
- QoQ
- Previous Quarter: ₹268.98 crore
- Growth: +1.2%
- YoY
- Previous Year: ₹316.11 crore
- Change: -13.9%
- QoQ Trend Insight:
- Revenue Trend: Strong Growth
- Profit Trend: Stable
Margin Analysis
- Rapid rise in finance costs (₹298 Cr vs ₹212 Cr QoQ)
- Higher operating costs from business scale-up
- Rising employee expenses due to platform buildout
- Fair value gains softened sequentially
Key Signal: Revenue is scaling faster than legacy base, but margin compression is visible due to growth-phase investment costs.
Segment performance
Segment Insight:
This quarter signals transition from treasury-income driven earnings toward operating lending and financial services driven earnings.
Characteristics:
- Loan book expansion accelerating
- Fee income ramp-up suggests ecosystem monetization improving
- Market-linked fair value gains becoming less dominant
- Core operating model strengthening
Earning quality check
Positive:
- Interest income nearly doubled YoY
- Fee income surged over 4x YoY
- Loan growth expanded materially
Negative:
- OCI volatility distorted reported total comprehensive income
- Profit growth lagged revenue growth
- Higher finance costs pressured earnings conversion
Interpretation: Operational earnings quality improving.
balance sheet analysis
- Total Assets: ₹1,63,497 crore
- Total Liabilities: ₹29,643 crore
Loans Book Expansion
- FY26: ₹25,710 crore
- FY25: ₹10,053 crore
- Growth: +155.7%
Investments
- FY26: ₹133,088 crore
- FY25: ₹118,910 crore
- Growth: +11.9%
Net Worth
- FY26: ₹133,854 crore
- FY25: ₹123,497 crore
- Growth: +8.4%
Indicates: Balance sheet is transforming from cash-heavy holding structure into active lending balance sheet
Cash flow analysis
Operating Cash Flow
- Negative ₹15,439 crore
- (Driven by loan book expansion — typical for financial institutions during growth phases)
Investing Cash Flow
- Negative ₹5,696 crore
Financing Cash Flow
- Positive ₹21,454 crore
Closing Cash
- ₹715 crore
Indicates: Negative operating cash flow appears growth-driven, not distress-driven, due to aggressive loan asset creation.
key risks
- Margin compression from rising funding costs
- OCI volatility from investment book
- Execution risk in scaling lending book
- Credit quality risk as loan book grows
- Elevated leverage relative to FY25
management strategy
- Expand lending franchise
- Scale fee-based businesses
- Build integrated financial services platform
- Increase deployment of investment capital
- Strengthen financing ecosystem
Financial Metrics
| Particular | In ₹ Crore | Q.O.Q (%) | Y.O.Y(%) |
|---|---|---|---|
| Total Income | 1,019.69 | +13.2 | +96.7 |
| PBT | 338.53 | -8.8 | -14.5 |
| PAT | 272.22 | +1.2 | -13.9 |
| EPS | 0.43 | +2.4 | -14.0 |
Jio Financial is showing strong core business momentum, especially in lending and fee businesses.
Official Exchange Filing: Jio Financial Limited
Quarterly Performance Context
FISCAL YEAR
2025-2026
AUDIT STATUS
REVIEWED