Quarter Ended: March 2026
JSW Infrastructure Limited – Q4 FY26 Results
NSE
jswinfra
BSE
543994
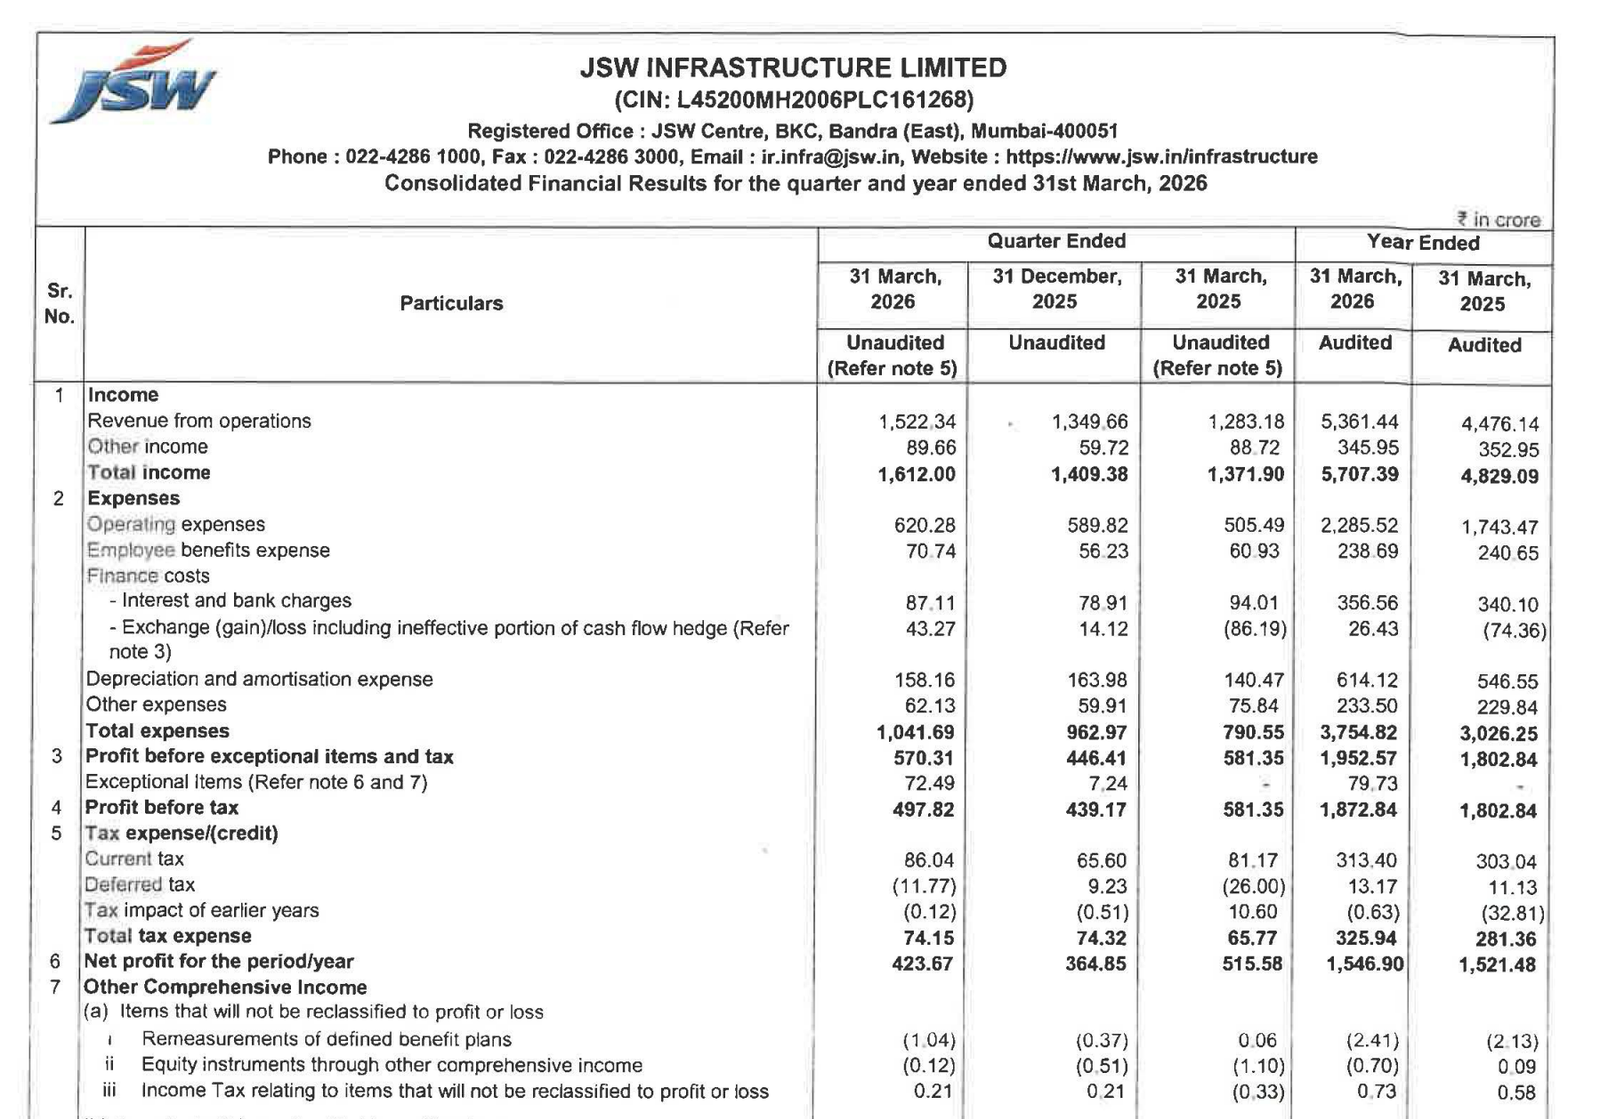
JSW Infrastructure reported strong Q4 FY26 operational growth driven by higher port cargo volumes, logistics expansion, and improved segment profitability despite margin pressure from finance costs and exceptional adjustments.
key financial highlights
- Revenue from Operations:
- Revenue Income (Q4 FY26): ₹1,522.34 Cr
- QoQ Change: +12.79%
- YoY Change: +18.64%
- Previous Quarter (Q3 FY26): ₹1,283.18 Cr
- Previous Year (Q4 FY25): ₹1,349.66 Cr
- Revenue Income (Q4 FY26): ₹1,522.34 Cr
- Profit After Tax (PAT):
- PAT (Q4 FY26): ₹423.67 Cr
- QoQ Change: +16.12%
- YoY Change: -17.83%
- Previous Quarter (Q3 FY26): ₹364.85 Cr
- Previous Year (Q4 FY25): ₹515.58 Cr
- PAT (Q4 FY26): ₹423.67 Cr
- QoQ Performance
- Revenue Trend: Strong Sequential Growth
- Profit Trend: Healthy Sequential Recovery
Margin Analysis
Drivers:
- Operating leverage improved due to higher cargo throughput.
- Logistics business margins expanded significantly.
- Finance costs increased due to higher borrowings and expansion projects.
- Depreciation expenses rose from infrastructure asset additions.
- Exceptional item impact affected profitability.
Insight:
- Core operating profitability remains strong despite elevated financing and expansion-related costs.
Segment performance
Segments: Port Operations
- Revenue: ₹1,294.50 Crore
- Insights:
- Main revenue contributor with strong throughput growth
Segments: Logistics Operations
- Revenue: ₹227.84 Cr
- Insights:
- Fastest-growing segment with significant profitability improvement
Segment insight
Summary:
- JSW Infrastructure continues diversifying beyond core port operations into integrated logistics and supply chain infrastructure, strengthening long-term growth visibility.
Charcateristics:
- Integrated port-logistics model
- Long-term infrastructure assets
- Strong cargo handling capability
- Strategic coastal connectivity
- Growing logistics footprint
- Expansion-led growth strategy
Earning quality check
Drivers:
- Strong operating cash generation of ₹2,021.50 crore.
- Stable segment profitability across core operations.
- Improved logistics business contribution.
- Large infrastructure capex supported future growth.
- Rising debt levels due to expansion projects.
Interpretations:
- Earnings quality remains fundamentally healthy, supported by recurring infrastructure cash flows and long-term operational contracts.
balance sheet Analysis
- Total Assets: ₹20,358.45 Crore
- Total Liabilities: ₹8,665.71 Crore
Insight:
- Balance sheet expanded significantly due to ongoing infrastructure investments.
- Capital work-in-progress increased sharply indicating future capacity growth.
- Net worth strengthened through retained earnings.
- Debt levels increased to support expansion activities.
key risks
- Rising leverage and finance costs.
- Global trade slowdown affecting cargo volumes.
- Infrastructure project execution risks.
- Regulatory and environmental clearances.
- Foreign exchange volatility impacting finance costs.
management strategy signals
Focus Area:
- Port capacity expansion
- Integrated logistics ecosystem
- Cargo diversification
- Infrastructure-led growth
- Operational efficiency enhancement
- Long-term concession expansion
Financial metrics table
| Particular | Q4 FY26 | Q.O.Q | Y.O.Y |
|---|---|---|---|
| Total Income | ₹1,612.00 Crore | +12.79% | +18.64% |
| PBT | ₹497.82 Crore | +13.35% | -14.37% |
| PAT | ₹423.67 Crore | +16.12% | -17.83% |
JSW Infrastructure delivered a strong operational Q4 FY26 performance supported by robust port activity, rapid logistics expansion, and healthy sequential profitability growth.
While yearly profitability saw pressure from higher finance costs and exceptional adjustments, the company’s long-term infrastructure growth strategy remains intact. Rising asset base, expanding logistics operations, and healthy operating cash flows position the company strongly for sustained future growth.
Official Exchange Filing: JSW Infrastructure Limited
Quarterly Performance Context
FISCAL YEAR
2025-2026
AUDIT STATUS
REVIEWED