Quarter Ended: March 2026
Leela Palaces Hotels & Resorts – Q4 FY26 Results Analysis
NSE
theleela
BSE
544408
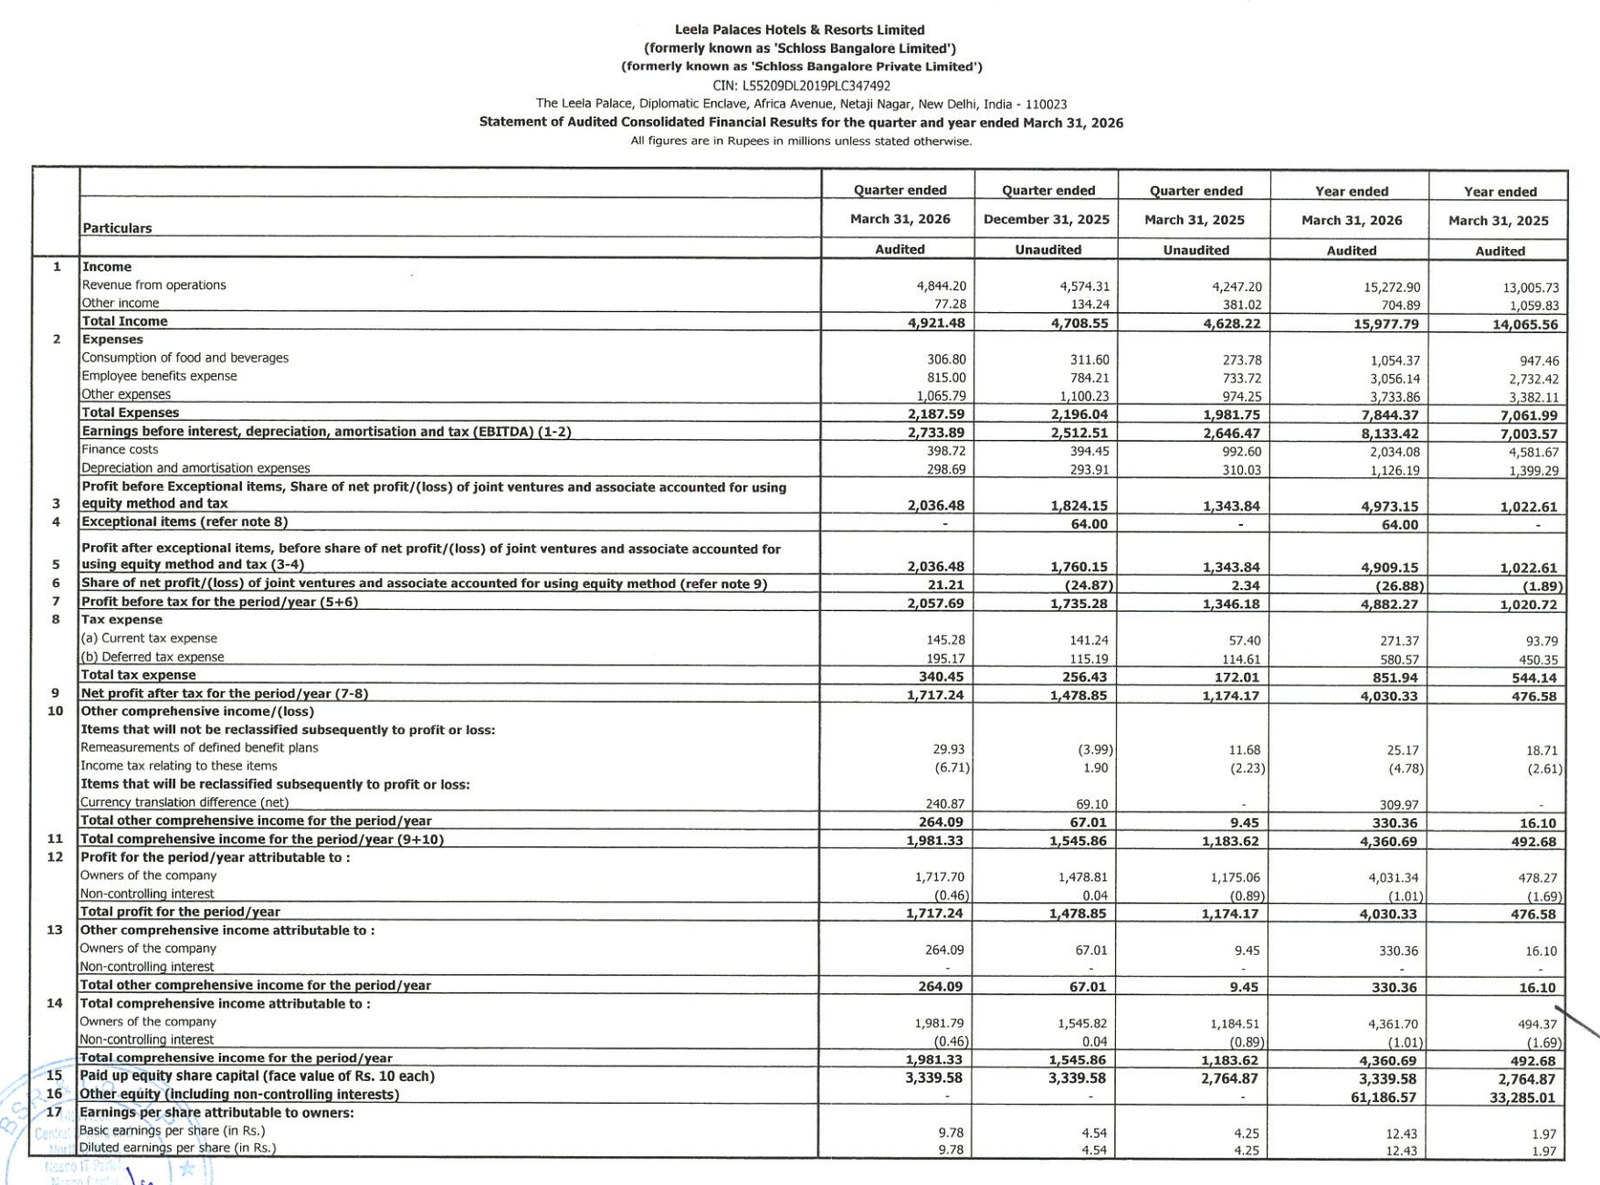
Strong rebound in profitability supported by improved operating performance, reduced finance costs, and balance sheet strengthening
key financial highlights
- Revenue from Operations:
- Revenue (Q4 FY26): ₹4,844.20 Million
- QoQ Change: +5.94%
- YoY Change: +13.99%
- Previous Quarter (Q3 FY26): ₹4,574.31 Million
- Previous Year (Q4 FY25): ₹4,247.20 Million
- Revenue (Q4 FY26): ₹4,844.20 Million
- Profit After Tax (PAT):
- PAT (Q4 FY26): ₹1,717.24 Million
- QoQ Change: +16.19%
- YoY Change: +46.28%
- Previous Quarter (Q3 FY26): ₹1478.85 Million
- Previous Year (Q4 FY25): ₹1174.17 Million
- PAT (Q4 FY26): ₹1,717.24 Million
- QoQ Performance
- Revenue Trend: Positive
- Profit Trend: Strong Growth
Margin Analysis
Key Drivers:
- Strong operating leverage in hospitality business
- Significant reduction in finance costs (₹2,034 Mn vs ₹4,581 Mn YoY)
- Stable cost structure despite revenue growth
- Higher premium occupancy / pricing power
Key Signal: Sharp margin expansion, driven by both operational improvement and financial restructuring
Segment insight
Summary:
- Performance driven by premium hospitality demand recovery and pricing strength
Characteristics:
- Strong growth in luxury segment demand
- Improved occupancy and ARRs
- Focus on high-margin properties
Earning quality check
Drivers:
- Core EBITDA strength
- Lower finance cost burden
- Minimal reliance on one-offs
Interpretation:
- Earnings quality is improving significantly, with transition from leveraged stress to stable profitability
balance sheet Analysis
- Total Assets: ₹89,236.84 Mn (~₹8,924 Cr)
- Total Liabilities: ₹24,710.69 Mn (~₹2,471 Cr)
Insight:
- Massive debt reduction (borrowings down sharply YoY)
- Strong increase in equity base (₹64,526 Mn)
- Improved liquidity position
- Transition towards healthier capital structure
key risks
- Cyclicality in hospitality demand
- High dependence on luxury segment
- Exposure to global travel trends
- Cost pressures (energy, staffing)
management strategy signals
Focus Area:
- Premium segment expansion
- Debt reduction
- Operational efficiency
- Enhancing occupancy and ARRs
Financial Metrics
| Particular | Q4 FY26 | Q.O.Q | Y.O.Y |
|---|---|---|---|
| Total Income | ₹492.15 Crore | +4.53% | +6.34% |
| PBT | ₹205.7 Crore | +18.62% | +52.70% |
| PAT | ₹171.7 Crore | +16.19% | +46.28% |
Leela Palaces has delivered a strong turnaround performance, with profitability surging due to operating leverage and a sharp reduction in debt burden. The company is now entering a high-margin growth phase, though sustainability will depend on maintaining premium demand momentum.
Official Exchange Filing: Leela Palaces Hotels & Resorts Ltd
Quarterly Performance Context
COST OF OPERATIONS AS % OF REVENUE
45%
NET PROFIT AS % OF REVENUE
35.45%
FISCAL YEAR
2025-2026
AUDIT STATUS
REVIEWED