Quarter Ended: March 2026
L&T Technology Services Ltd – Q4 FY26 Results Analysis
NSE
ltts
BSE
540115
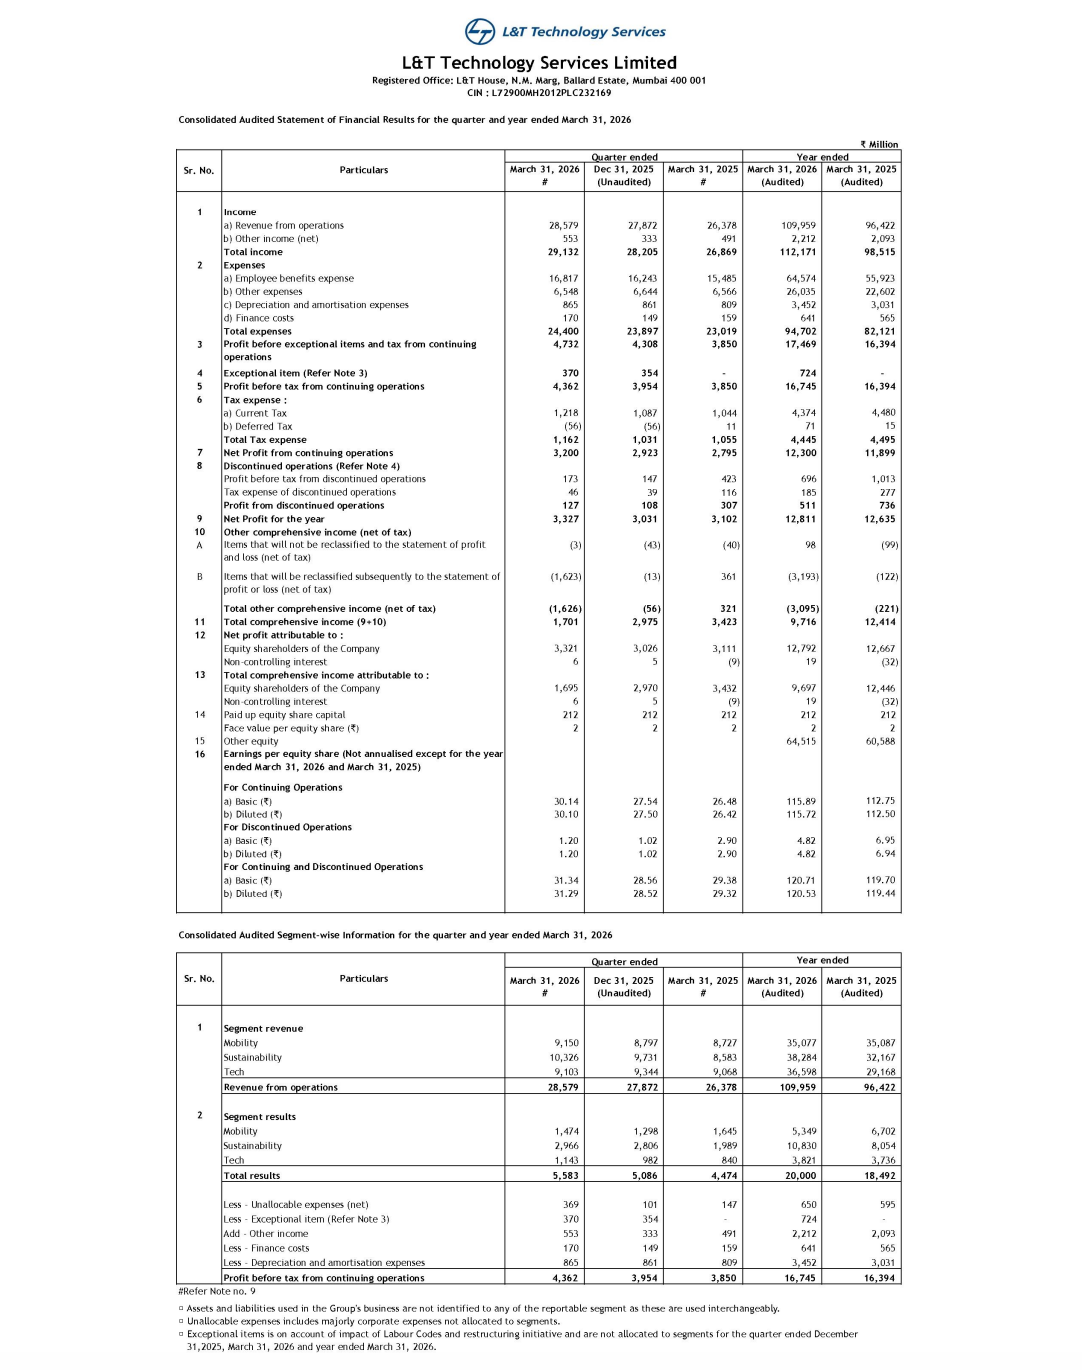
LTTS delivered stable revenue growth along with strong improvement in profitability, driven by operating leverage and segment performance
key financial highlights
- Revenue from Operations:
- Total Income (Q4 FY26): ₹29,132 Million
- QoQ Change: +3.22%
- YoY Change: +8.34%
- Previous Quarter (Q3 FY26): ₹28,205 Million
- Previous Year (Q4 FY25): ₹26,869 Million
- Total Income (Q4 FY26): ₹29,132 Million
- Profit After Tax (PAT):
- PAT (Q4 FY26): ₹3,327 Million
- QoQ Change: +9.77%
- YoY Change: +7.25%
- Previous Quarter (Q3 FY26): ₹3,031 Million
- Previous Year (Q4 FY25): ₹3,102 Million
- PAT (Q4 FY26): ₹3,327 Million
- QoQ Performance
- Revenue Trend: Stable Growth
- Profit Trend: Growth
Margin Analysis
Key Drivers:
- Controlled cost growth
- Strong segment contribution
- Operating leverage benefits
Key Signal: Margins are expanding gradually, indicating efficiency improvement
Segment performance
Segment: Sustainability
- Revenue: ₹10,326 Million
Insights:
- Strong growth segment
- Increasing contribution
Segment: Mobility
- Revenue: ₹9,150 Million
Insights:
- Stable and consistent performer
Segment: Tech
- Revenue: ₹9,103 Million
Insights:
- Balanced contribution
- Supports diversification
Segment insight
LTTS operates across Mobility, Sustainability, and Tech segments, offering engineering R&D services.
Characteristics:
- Global client base
- Engineering services-led model
- Strong digital and ER&D positioning
Earning quality check
Drivers:
- Core operational revenue growth
- Minimal reliance on exceptional items
- Balanced segment contribution
Interpretation:
- Earnings are high quality and operationally driven, indicating sustainable growth
balance sheet Analysis
- Total Assets: ₹104,889 Million
- Total Liabilities: ₹39,962 Million (Derived)
Insight:
- Strong balance sheet with high equity base and low leverage, supporting future growth
key risks
- Dependency on global engineering demand
- Client concentration risk
- Currency fluctuations
- Slowdown in tech spending
management strategy signals
- Expansion in sustainability & digital engineering
- Strengthening global delivery
- Margin improvement initiatives
Financial Metrics
| Particular | Q4 FY26 | Q.O.Q | Y.O.Y |
|---|---|---|---|
| Total Income | ₹29,132 Million | +3.22% | +8.34% |
| PBT | ₹4,362 Million | +10.22% | +13.30% |
| PAT | ₹3,327 Million | +2.10% | +7.25% |
LTTS delivered a strong and consistent performance, with steady revenue growth and improving margins. The business remains fundamentally strong with high-quality earnings and global exposure.
Official Exchange Filing: L&T Technology Services Ltd
Quarterly Performance Context
FISCAL YEAR
2025-2026
AUDIT STATUS
REVIEWED