Quarter Ended: March 2026
Oracle Financial Services Software Ltd – Q4 FY26 Results Analysis
NSE
ofss
BSE
532466
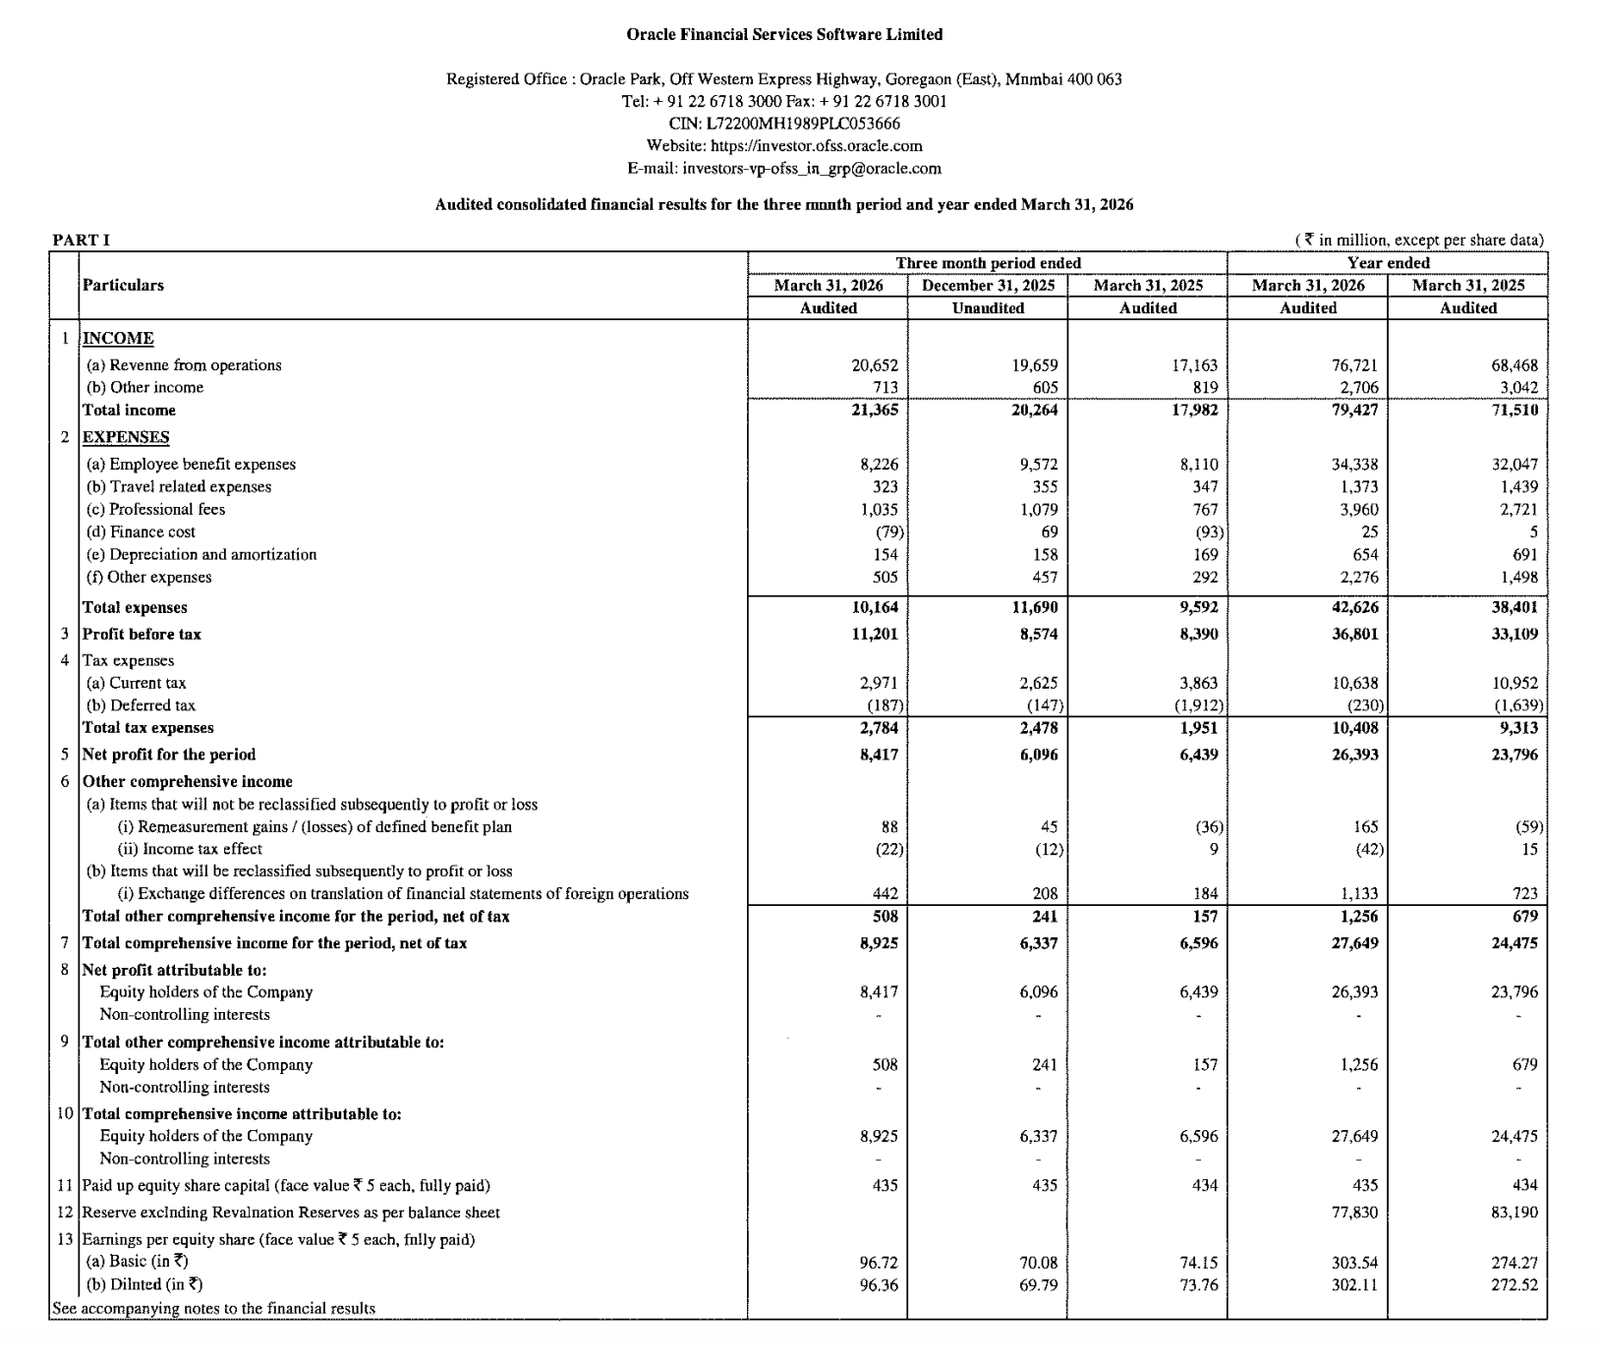
OFSS delivered strong profitability growth with controlled expenses, though revenue growth remained moderate.
key financial highlights
- Revenue from Operations:
- Total Income (Q4 FY26): ₹21,365 Million
- QoQ Change: +5.43%
- YoY Change: +6.17%
- Previous Quarter (Q3 FY26): ₹20,264 Million
- Previous Year (Q4 FY25): ₹17,982 Million
- Total Income (Q4 FY26): ₹21,365 Million
- Profit After Tax (PAT):
- PAT (Q4 FY26): ₹8,417 Million
- QoQ Change: +38.09%
- YoY Change: +30.74%
- Previous Quarter (Q3 FY26): ₹6,096 Million
- Previous Year (Q4 FY25): ₹6,439 Million
- PAT (Q4 FY26): ₹8,417 Million
- QoQ Performance
- Revenue Trend: Moderate Growth
- Profit Trend: Strong Growth
Margin Analysis
Key Drivers:
- Significant reduction in expenses QoQ
- Operating leverage kicking in
- Stable revenue base
Key Signal: Sharp margin expansion, indicating strong cost control and efficiency
Earning quality check
Drivers:
- Core operational profit growth
- No heavy reliance on exceptional income
- Expense compression
Interpretation:
- Earnings are high-quality and sustainable, backed by core operations
balance sheet Analysis
- Total Assets: ₹99,339 Million
- Total Liabilities: ₹21,074 Million (Derived)
Insight:
- Strong balance sheet with high cash & low leverage, indicating financial strength
key risks
- Dependency on BFSI sector demand
- Global IT spending slowdown
- Currency fluctuations
- Client concentration risk
management strategy signals
- Strengthening BFSI product suite
- Expanding global footprint
- Improving operational efficiency
Financial Metrics
| Particular | Q4 FY26 | Q.O.Q | Y.O.Y |
|---|---|---|---|
| Total Income | ₹21,365 Million | +5.43% | +6.17% |
| PBT | ₹11,201 Million | +30.60% | +33.50% |
| PAT | ₹8,417 Million | +38.09% | +30.74% |
OFSS delivered a standout quarter driven by margin expansion and strong profit growth. While revenue growth remains moderate, profitability strength makes this a high-quality performer
Official Exchange Filing: Oracle Financial Services Software Ltd
Quarterly Performance Context
COST OF OPERATIONS AS % OF REVENUE
48%
NET PROFIT AS % OF REVENUE
39.39%
FISCAL YEAR
2025-2026
AUDIT STATUS
REVIEWED